
My friend Tania Ketenjian interviewed Eve Ekman and I about our project with the Dalai Lama, the Atlas of Emotions, the other week for the BBC World Service. You can listen to the episode here (we’re on at 20:35), and what follows is a transcript of that interview.
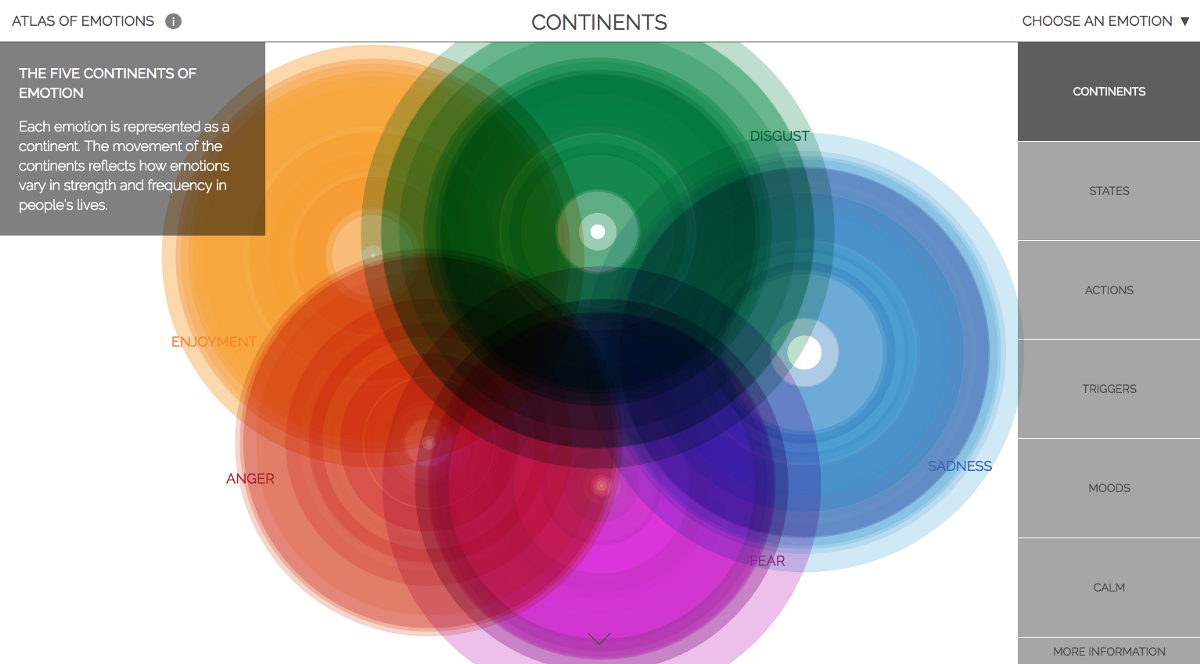
Tina Daheley: Empathy is also at the heart of another creative endeavor which has brought together scientists, designers, and a Buddhist monk. The Atlas of Emotions is a free online tour that’s been designed to help us talk about our feelings and it’s even being used in psychotherapy. If you want to try it out for yourself, search for Atlas of Emotions online. When you open it up, you see five rainbow-colored circles, almost like floating lilypads, each representing a different emotion. I spent a long time exploring the color coded circles and realized that if I was feeling blue, which is sad, it might help me to identify the triggers, all the way from not being invited to a party to losing a loved one, and recognize my responses from withdrawing, to protesting, to mourning.
It reminded me of one of my favorite cartoon films, Disney’s Inside Out. It’s set inside the mind of an 11-year-old girl and the characters are her feelings. But the project was actually inspired by the Dalai Lama, exiled spiritual leader of Tibet, the British territory that’s governed as an autonomous region of China. Well, then he recently made the news for discussing yoga with pop star Lady Gaga. In 1989, he won the Nobel Peace Prize for his nonviolent struggle for the liberation of Tibet. What’s less well-known is that he’s also been collaborating with scientists to try and promote not only peace on earth, but peace of mind. For The Cultural Front Line we spoke to the San Francisco scientists and the designer, about how they realized the Dalai Lama’s ambition to map the mind.
Eve Ekman: The Atlas of Emotion is developing a visual language for people to understand emotion. It’s purely visual in its experience, and our biggest goal was to make that something anyone could access and use without needing to hear description, without any prior knowledge. Some sort of intuitive way to experience their own emotions and see how it unites them to others. The first moment we were aware that we would get funding, my dad and I did what researchers do. We looked for what was out there and found what was claimed to be the best cartographers.
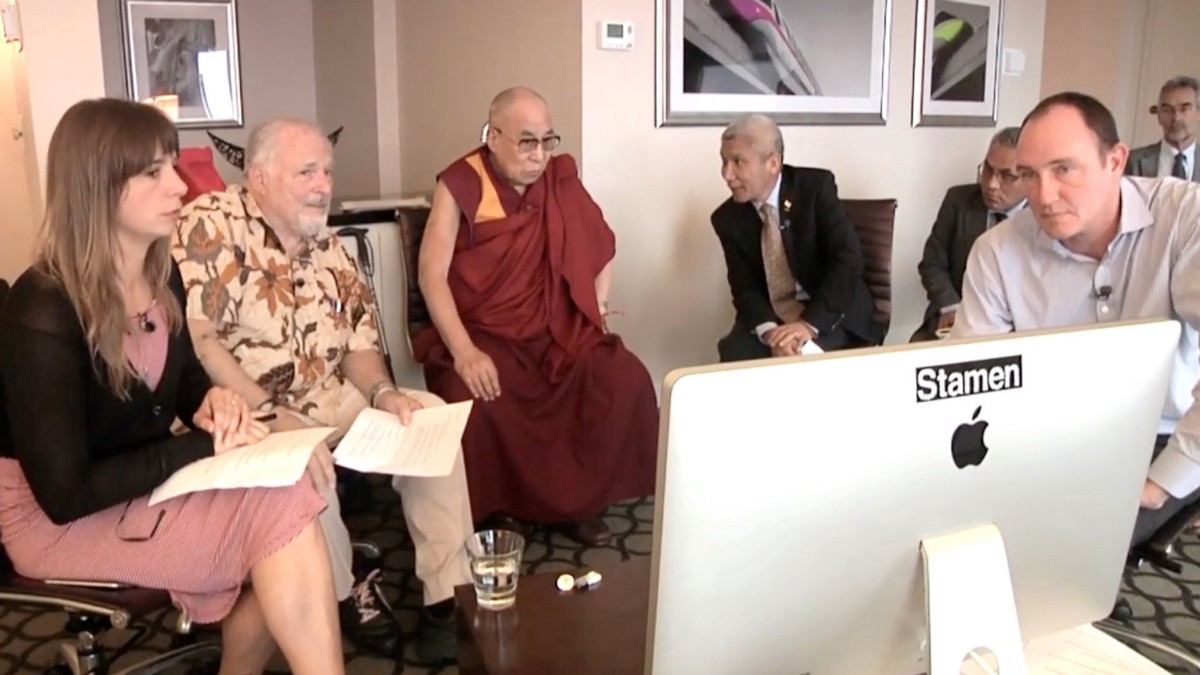
Eric Rodenbeck: Stamen is my design firm and we’re up for the challenge of visualizing complex information. When Eve and Paul came to us and said that the Dalai Lama would like for you make an Atlas of Emotions, I hesitated for about two seconds because I had absolutely no idea how I was going to do that. And then I said yes enthusiastically. It’s been a great ride!
EE: The Dalai Lama said, in order to get to the New World, we needed a map. And in order to get to emotional awareness, we need a map. There are five emotions which 50% of emotion researchers agree on as being universal. This was anger, fear, sadness, enjoyment, and disgust.
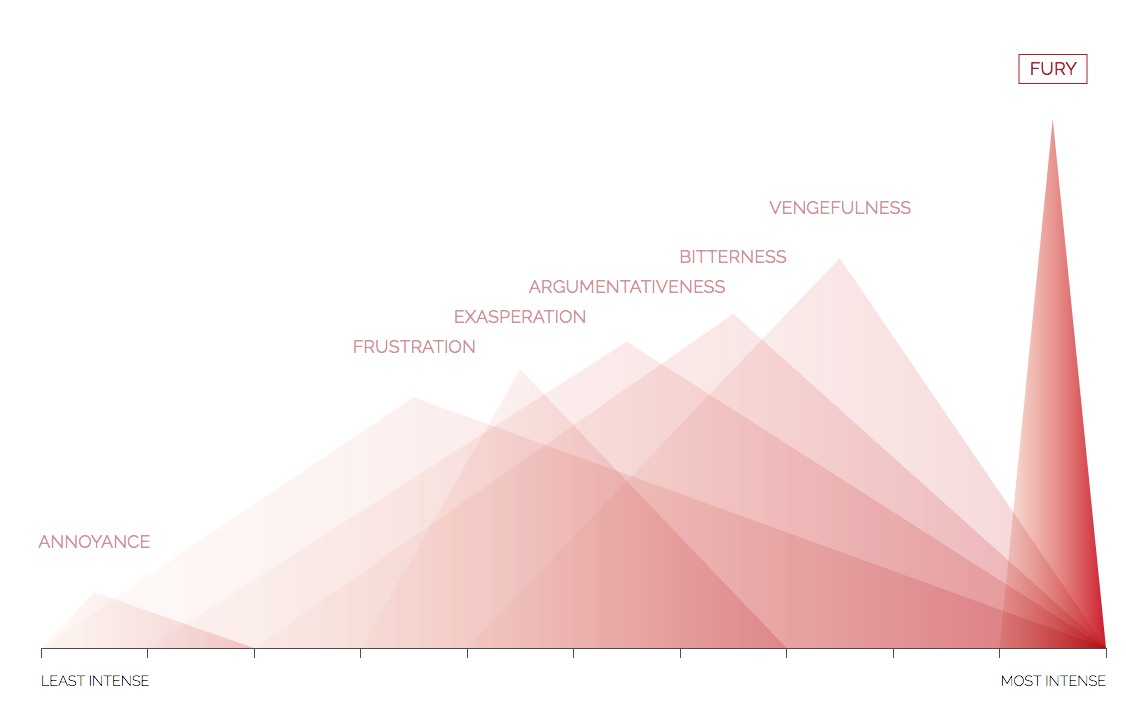
ER: Sadness is blue and then the other thing is that it’s kind of fuzzy. Green is what we use for disgust and the shapes are kind of poopy. Enjoyment is yellow, and bubbly, and kind of fun. Anger is spiky, and “uurgh,” and red. And fear is purple and kinda sketchy. And that was one of the most fun things about the project, was this moment where we realized that we could treat each emotion differently, that we could use code to be able to make the things seen in a different way. Within each emotion, there are different emotional states that overlap with one another in different ways. In anger for example, annoyance is pretty slight on the scale and you can that in the atlas, it’s very small. Whereas fury is only ever very intense and it’s kind of big and spiky around the ends, so there’s these visual cues that start to underscore different kinds of metaphors.
ER: What happens when you put them on the map and you put them near each other is it just leaps off the page. Chasing those kinds of moments where even an expert researcher has just never thought about those kinds of things was a really enlightening part of the process.
For me, the process of taking something that’s quite technical — like data — and finding a way to express it that is true to itself cuts past language and tickles your brain in a different way. If you’re doing it well and you’re doing it right, it feels like it grows out of the page or off of the screen rather than having been put there. And I love that feeling of something new and something beautiful and real that we didn’t know was there before. There’s an element of discovery in this that I find irresistible.
EE: Recently, what people have been telling me, they’ve been using it for — there’s a doctor I work with at San Francisco General Hospital. She’s been using the atlas to work with her severely depressed patient who has a really hard time describing her feelings and the atlas has been enormously helpful. That meant so much to me. And then I’ve heard some other descriptions of people who teach emotion and using it as a tool as homework. And then the teaching I’ve done with the atlas, people just light up. The visual just invites them to talk about a subject they’d most likely rather leave at home, unless their folks were already interested. I think the huge piece for me that’s been rewarding is seeing how this visualization excites people.
The Atlas is online here, and you can read more about the project on our blog.