In July 2015, after my first two years at Stamen, I wrote a blog post called “Year Two at Stamen”. It’s now been another three (plus) years since then, and a lot has happened.
Shortly after I wrote that last blog post, my role changed from Design Technologist to Lead Cartographer, later also adding Director of Training to my responsibilities. Titles like these are an odd thing at a place as collaborative and cross-disciplinary as Stamen. We’re also a surprisingly small team: we’ve never had more than a dozen people on staff at any time, and we all have meaningful leadership roles and responsibilities across multiple facets of the work we do. Getting to take a more public role advocating and supporting the amazing work of my colleagues is a huge privilege.
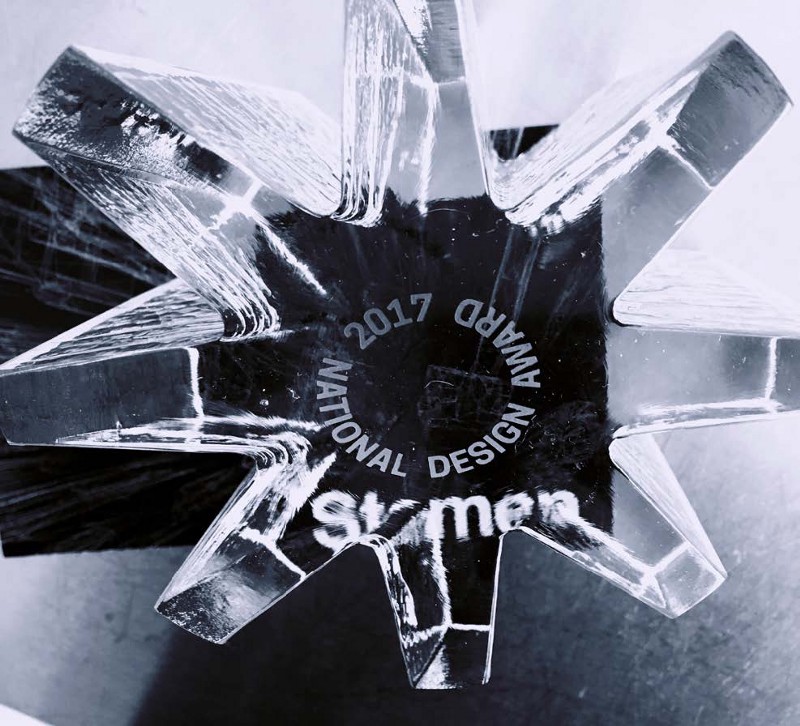
One of Stamen’s proudest achievements over the past few years was winning the 2017 National Design Award for Interaction Design from the Smithsonian Museum. This award recognizes the entire history of Stamen’s output, going back to 2001. It feels great to be recognized as part of this amazing legacy of work from years of Stamen alums who came before us.
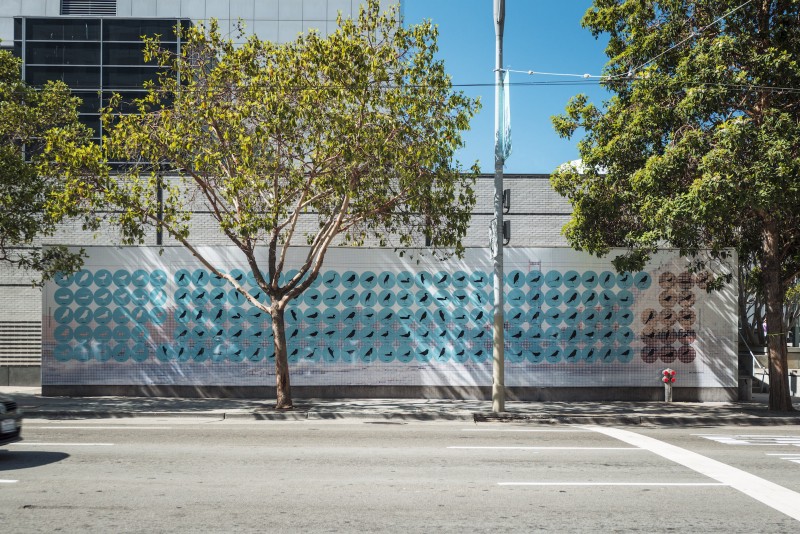
We were also pleased to have some of our work with the Audubon Society included in YBCA’s “Bay Area Now” show of art and design. Here is our wall-sized data visualization showing the impact of climate change on bird species in San Francisco:
Recent Projects
Since my last post, we’ve launched a ton of projects that I was lucky to be a part of. Here are a few of the highlights. I won’t go into much detail for any of these, but I’ll provide links to each one where you can read more. (Also, check out our end-of-year summaries for 2016 and 2017).
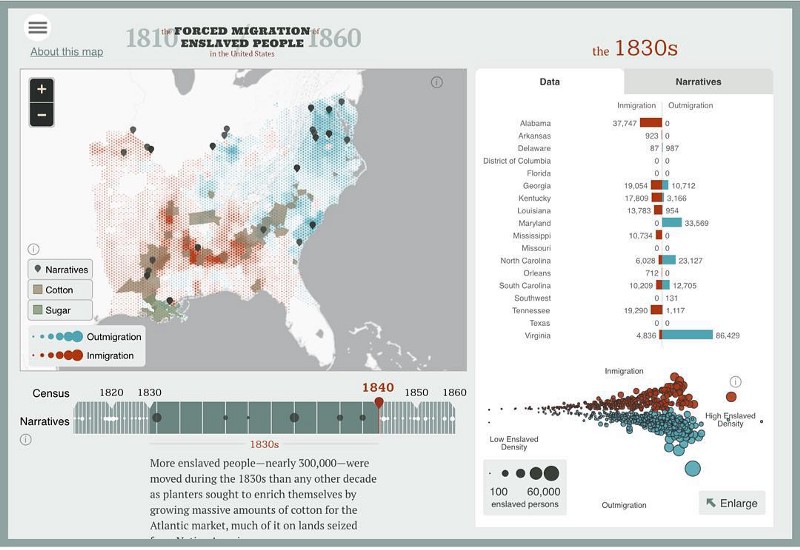
At the end of 2015 we launched our biggest project so far: American Panorama. This interactive atlas of American History includes maps about slavery, immigration, and more. I also gave a presentation about the project at the University of San Francisco Data Visualization Speakers Series.
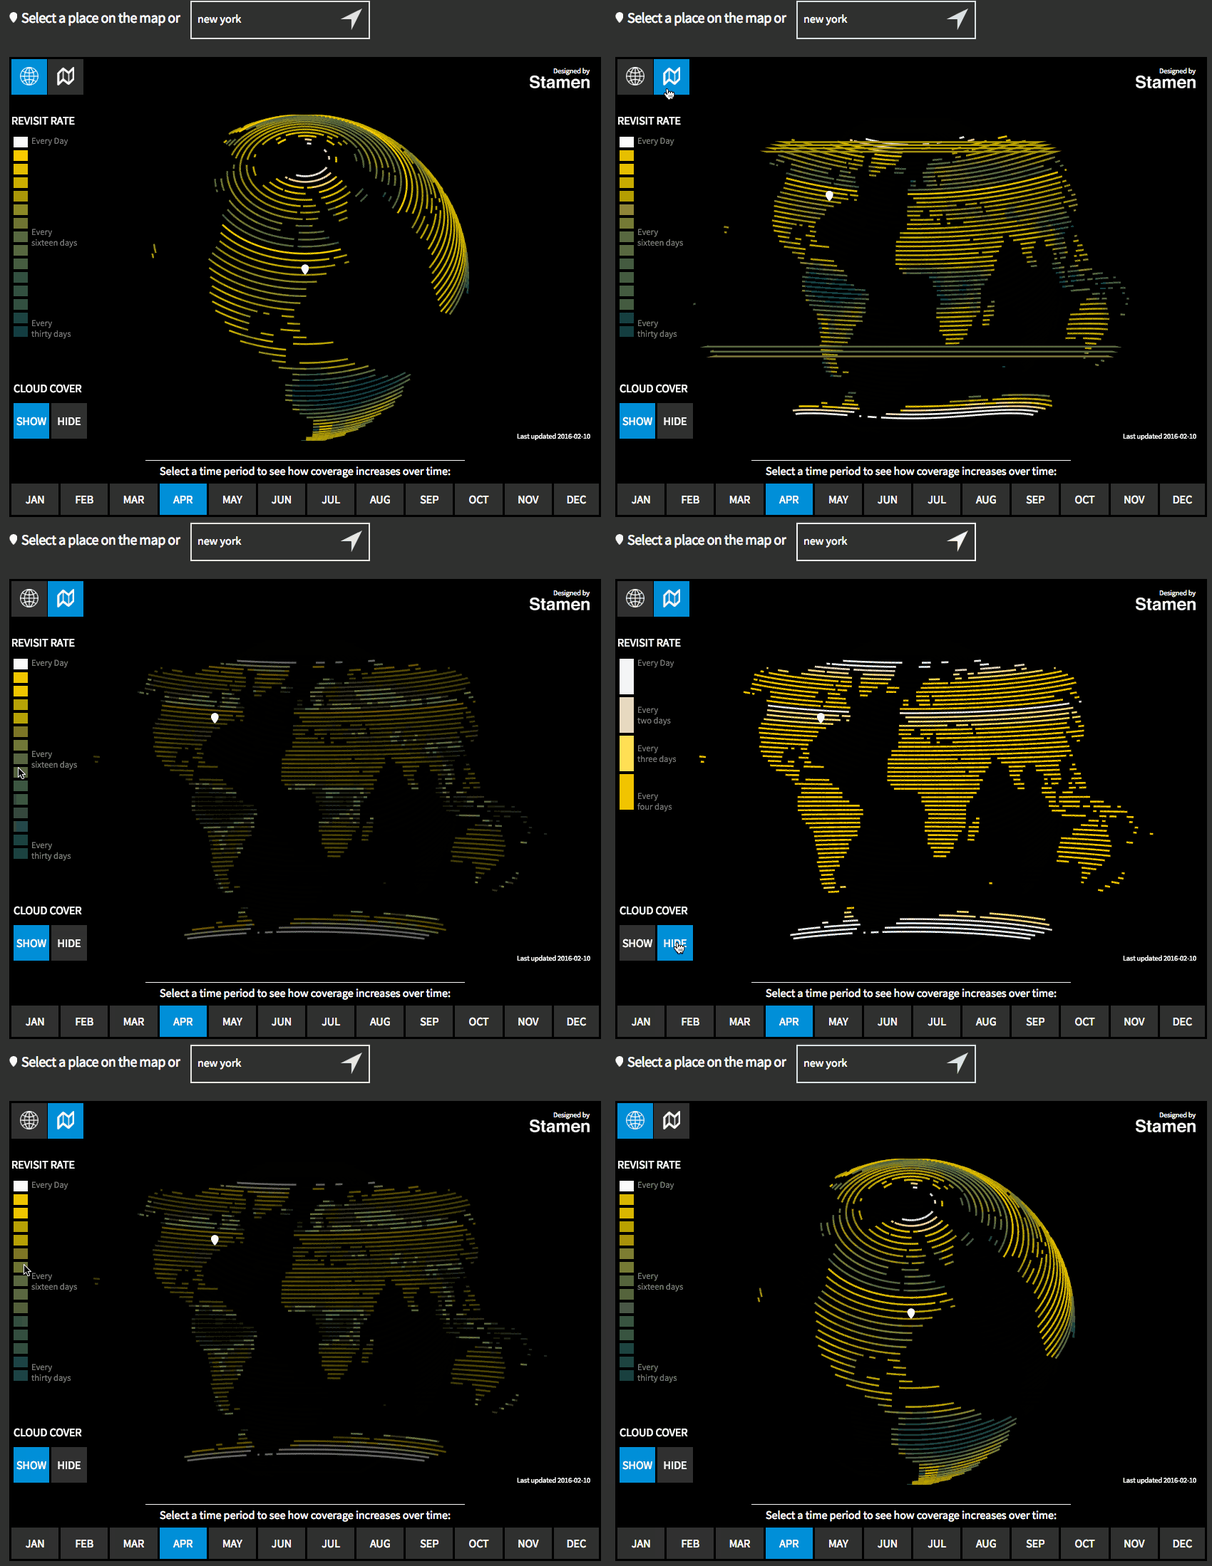
We did a project for Planet Labs (now called Planet), visualizing the orbital coverage of their satellite constellation.
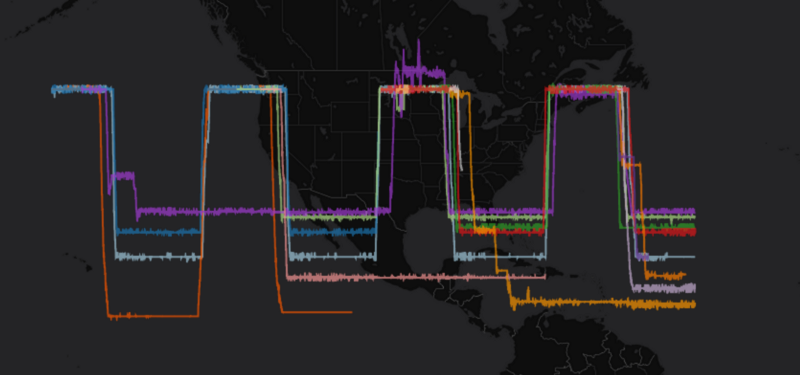
We’ve been doing a bunch of maps for environmental conservation efforts at MPG Ranch. The first project we did with them was mapping GPS tracks of ospreys as they migrate across North America. One of the early prototype visualizations (that didn’t make it into the final project) is this chart of the osprey data charting time along the x axis and latitude on the y axis:
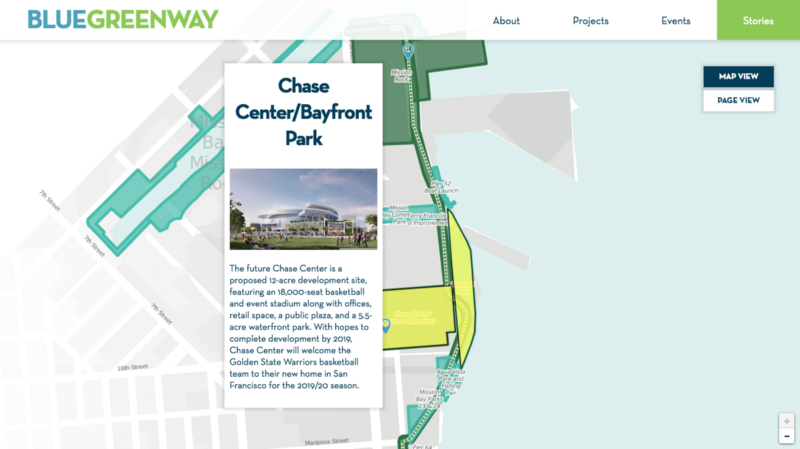
We mapped trails and parks along the San Francisco waterfront for SF Parks Alliance:
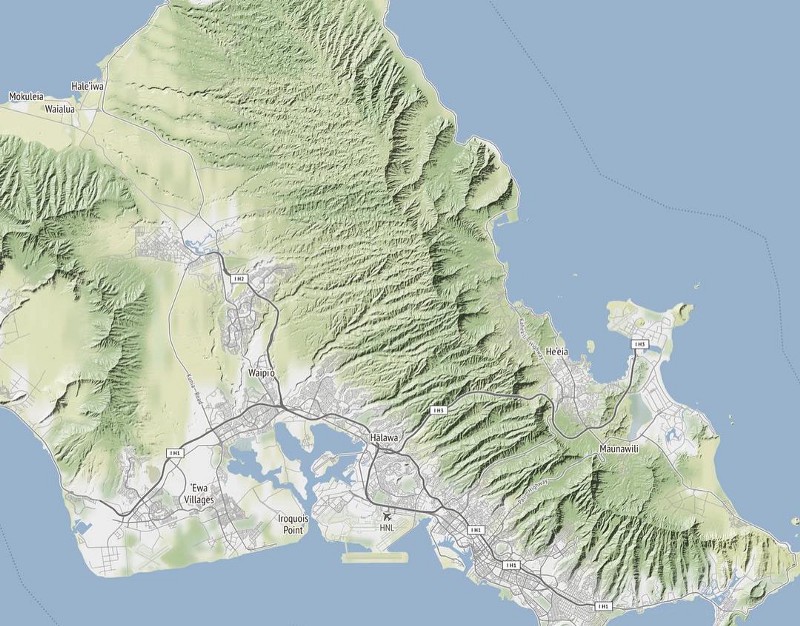
We updated the elevation data for our global Terrain map:
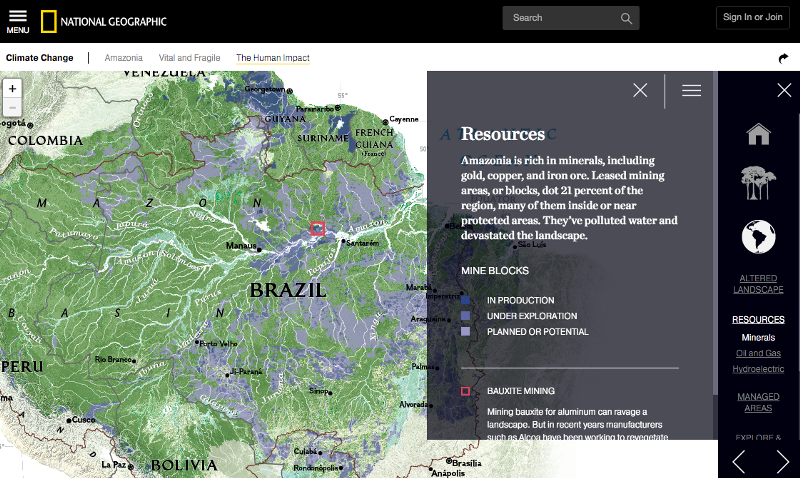
We also got to help bring some gorgeous National Geographic maps to the web:
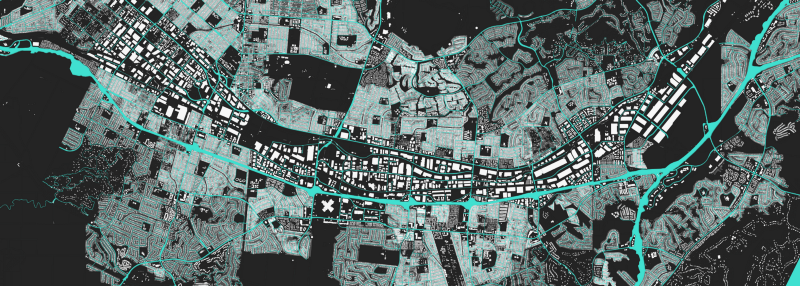
I also assisted with importing open data of building footprints into OpenStreetMap, which led to some lovely abstract maps that fell out of the data exploration process. Here’s a map showing nothing but buildings and parcels across Los Angeles County:
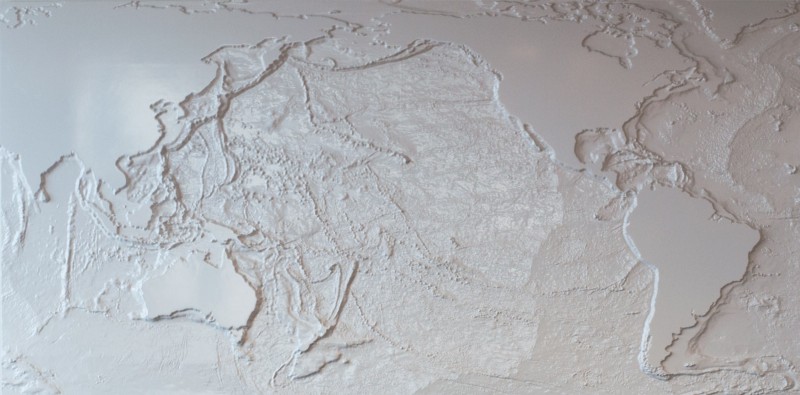
We made a giant 3d wall map of the ocean…
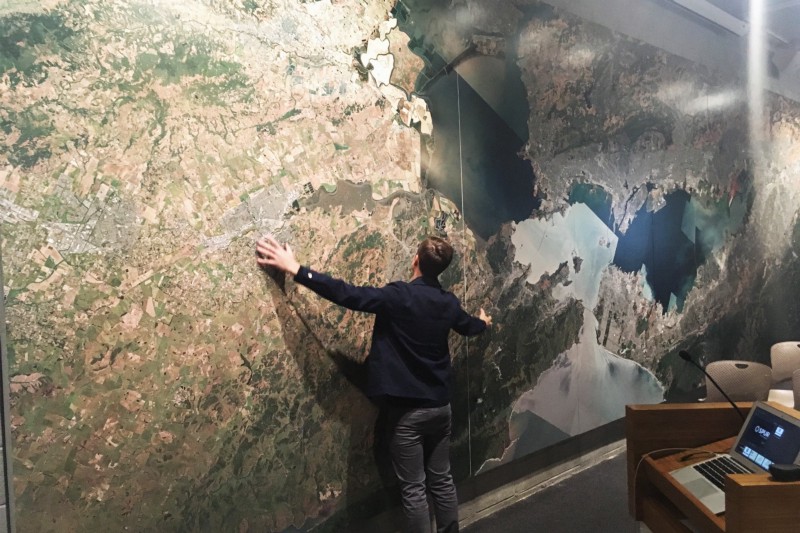
…and a huge map of the Bay Area for SPUR.
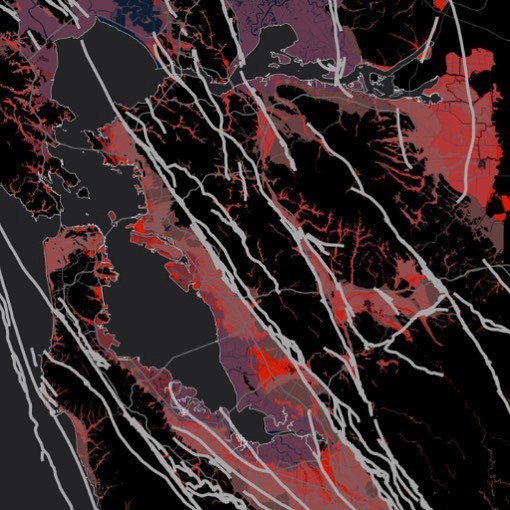
We mapped seismic and sea-level-rise hazards as part of the Resilient By Design Challenge:
And most recently we worked with HERE Developers to explore their new XYZ Maps, building a series of tutorials to showcase different aspects of the platform.

Presentations
In the last few years I’ve represented Stamen at several conferences and other venues, such as speaking at CartoSummit at the Esri campus in Redlands, or presenting at Stanford’s GIS Day behalf of our partners at CARTO.
If you want to watch a few presentations that were recorded, here are some links:
“Open Source Cartography: Blending Data and Design for the Next Generation of Online Maps” at WWU’s speaker series.
“Doing Cartography as Professional Amateurs” at the NACIS conference.
“Visualizing the Past, Building Tools for the Future” at the University of San Francisco.
“OpenStreetMap pasts, OpenStreetMap futures” at the State of the Map US conference.
Workshops and teaching
In addition to giving presentations like those, we’ve been doing more workshops and classes at Stamen, some in our San Francisco studio, and some onsite at our clients’ offices. If you want to get notified about future classes, you can sign up for our mailing list.
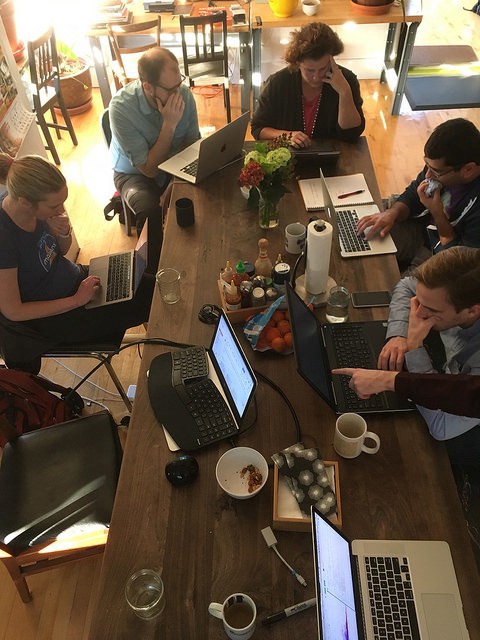
Huge thanks to the people who have taught these classes along with me or who have helped prepare some of the materials, such as Ian, Curran, Logan, and of course my Maptime compatriots Beth and Lyzi!
Speaking of Maptime, we original founders of the movement have all decided it’s time for us to move on to other things. While we’re still sticking around in an advisory capacity, the worldwide network of Maptime meetups is now still going strong without us! For more on our thoughts about saying farewell to Maptime, I can’t recommend enough Beth’s blog post and conference talk about this tough decision. Supporting an open source movement is exhausting work! ❤️ 🌈
Farewell to the PhD
In other goodbyes, a couple of years ago I also decided it was time to end my work on the PhD at UBC. Trying to finish the dissertation while working full time at Stamen (and filling my plate with many other satisfying endeavors) no longer felt worth the effort. I feel like I got everything I wanted to get out of grad school, and was already doing my dream job at Stamen. Also, on a more practical level, trying to write a dissertation about a fast-moving topic like open source mapping meant that the longer it took me to write the thing, the more out of date parts of it became.
In the end, part of my research did get published in “ACME: An International Journal for Critical Geographies” (which you can read here), and other parts were presented at the OpenStreetMap conference (and “published” on Medium). In this way I hope at least I contributed back to OpenStreetMap’s discussions about what kinds of participation are valuable, and in general helped an open source community understand itself a bit better. The fact that I didn’t become a “Doctor” in the process doesn’t bother me in the slightest. I appreciate all the support I had from my academic advisors and colleagues, and I hope I will be able to pay that forward even from a place outside the academy.
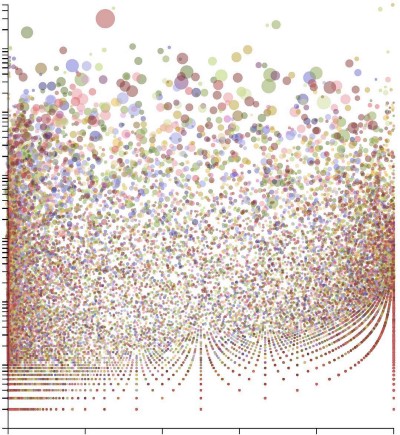
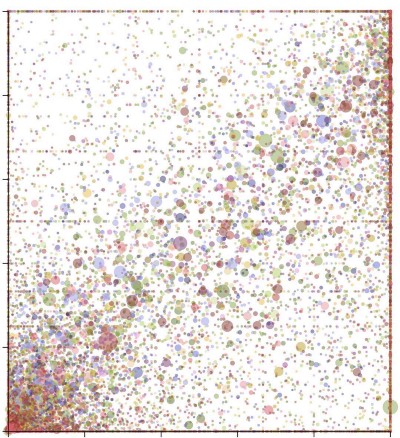
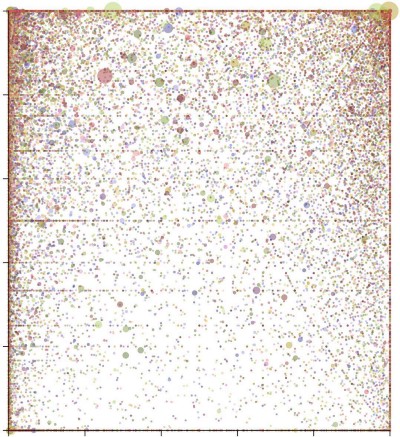
I also got some cool data art out of the whole thing:
In other news…
A couple of years ago I switched to working remotely, moving from San Francisco back to my hometown of Bellingham, Washington. Personal updates would easily take up another blog post or two, but for now here are some of the things keeping me busy locally:
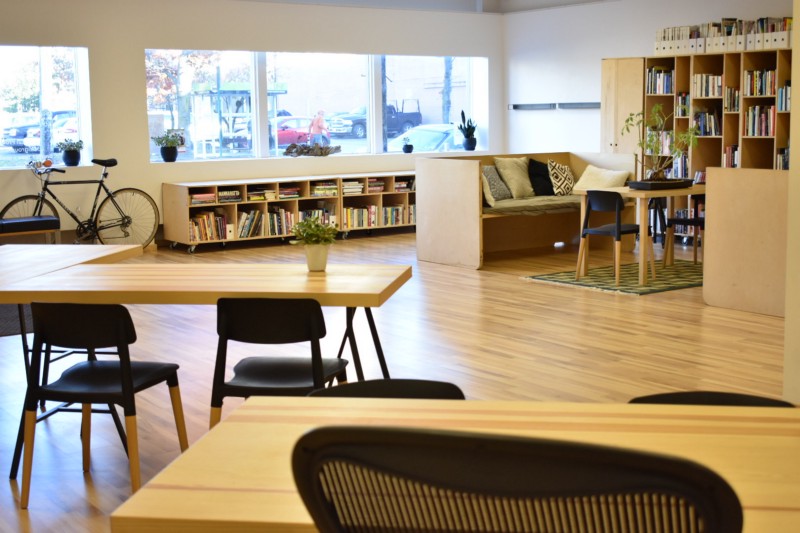
- I started a coworking space in Downtown Bellingham called Localgroup Studio. Stop by if you’re ever in town!
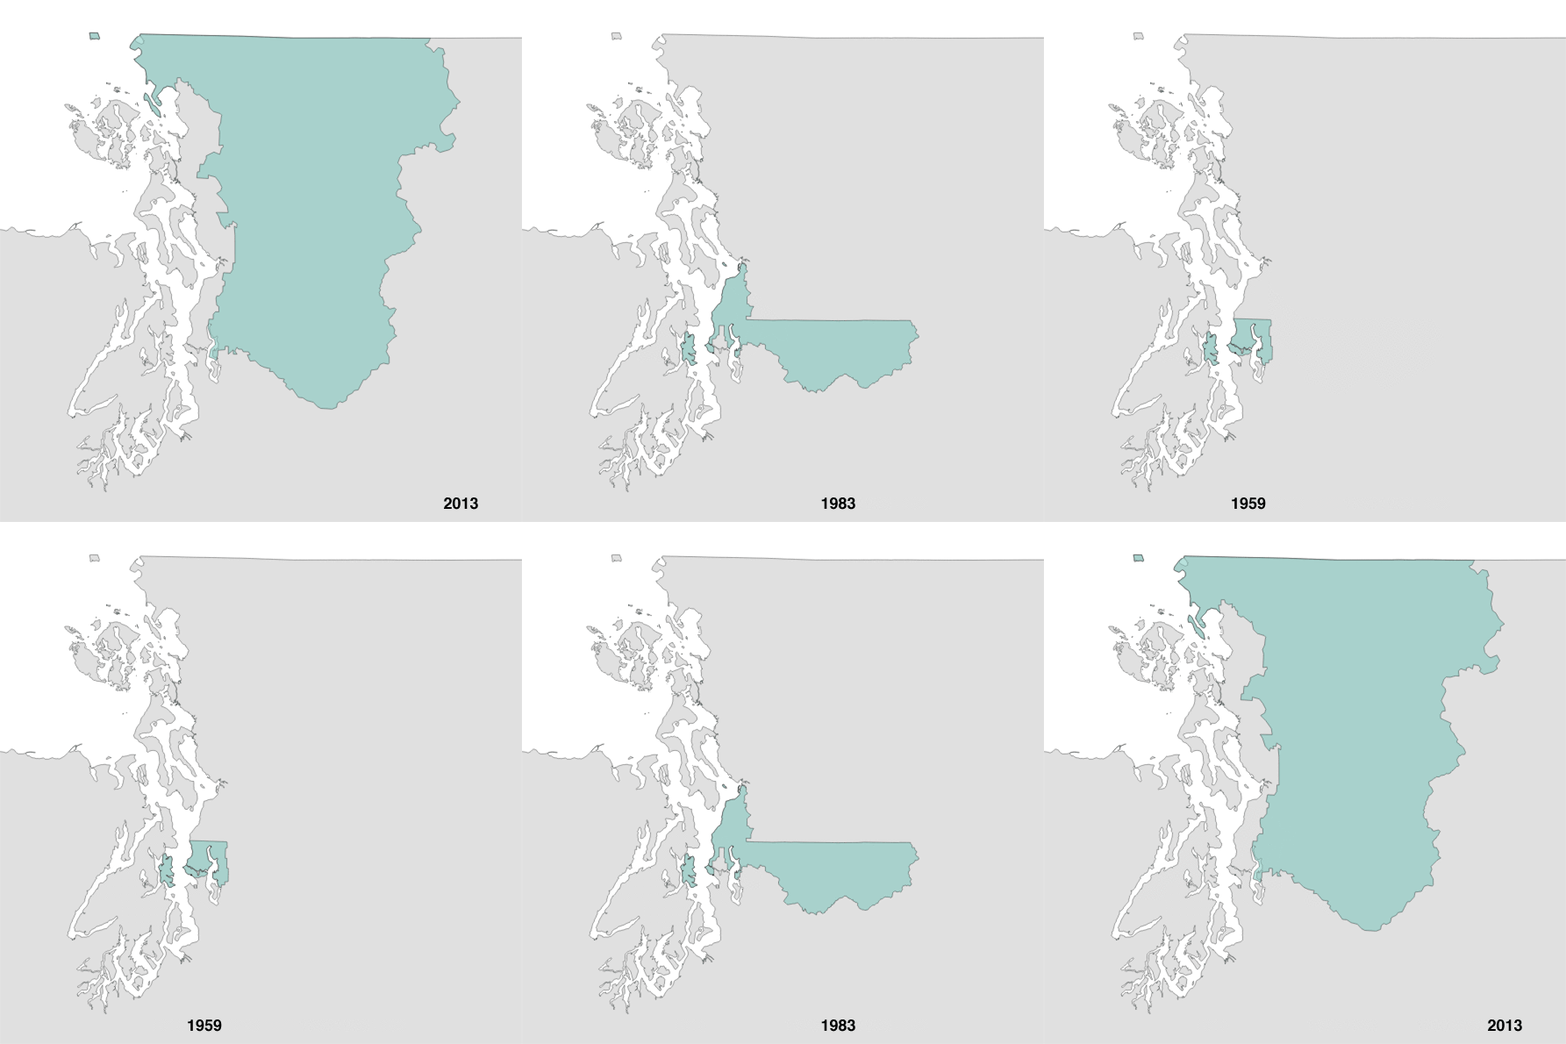
- I co-founded FairVote Washington, a new state chapter of FairVote dedicated to electoral reforms like Ranked Choice Voting and Proportional Representation. I’ve also been making some maps of gerrymandering along the way.
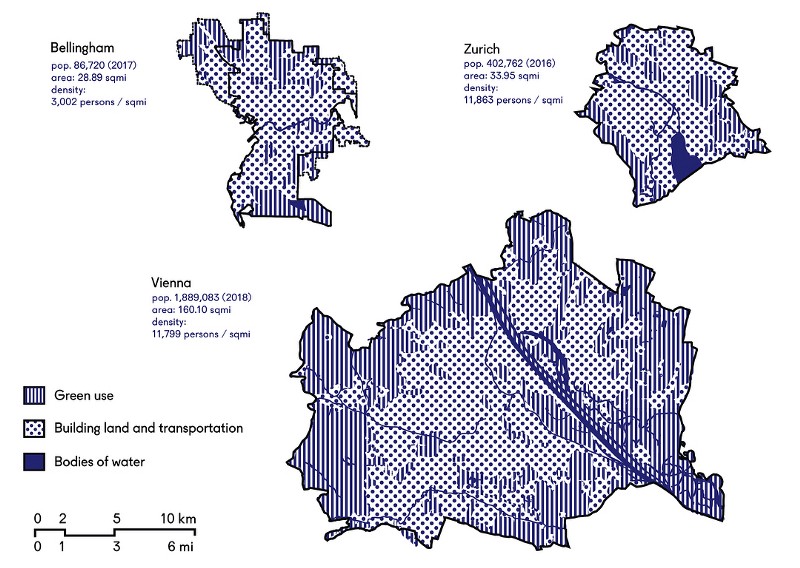
- I helped put on an exhibition of The Vienna Model, exploring how we can bring alternative forms of affordable housing to Bellingham.
What’s next?
At Stamen we’ve got some great projects in the pipeline that are just about to launch, including one about mapping the intersection of real estate and arts organizations, and another one using a wide variety of data visualizations to explore the changing demographic diversity of cities around the world, to name just a couple. Stay tuned to hi.stamen.com for the latest updates, and follow me at @mappingmashups on twitter for more news from my side of things.

