Skip to content
Helping people find and tell more beautiful stories with data
Work
Services
Data Storytelling
Interactive Data Experiences
Full Stack Cartography
About
Our Story
People
Press
Blog
Contact
Blog
Musing on data viz, map making, and everything else from
Stamen Design
Projects
Podcast
Process
Latest
Roundups
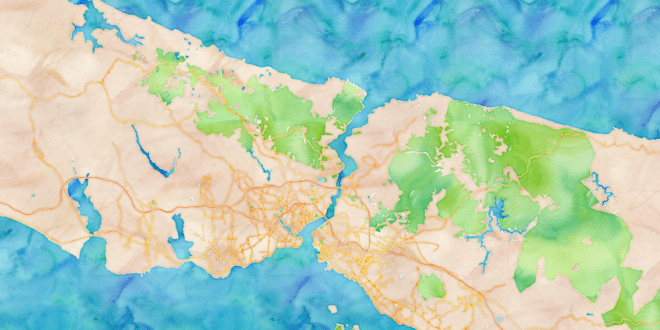
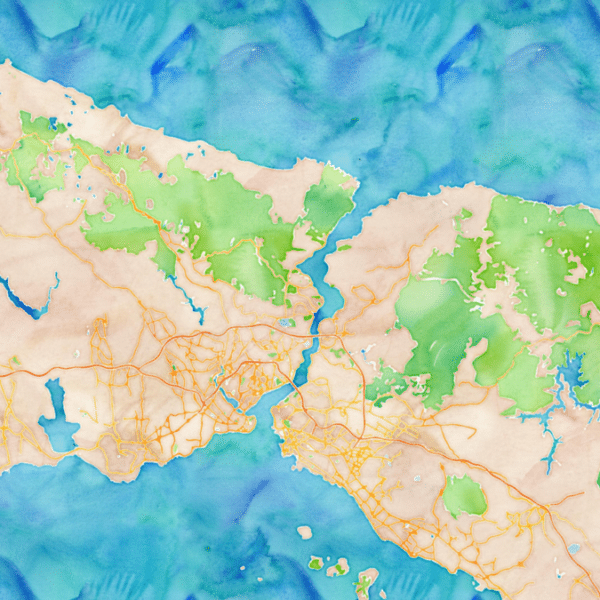
Our Brilliant Friend: Stamen and OpenStreetMap through the years, part 1
Alan McConchie | 05.05.21
Events
Save the date! Stamen & Smithsonian in dialogue about museums & maps
Eric Rodenbeck | 05.03.21
Events
Stamen Design on the Geomob Podcast
Alan McConchie | 04.28.21
Process
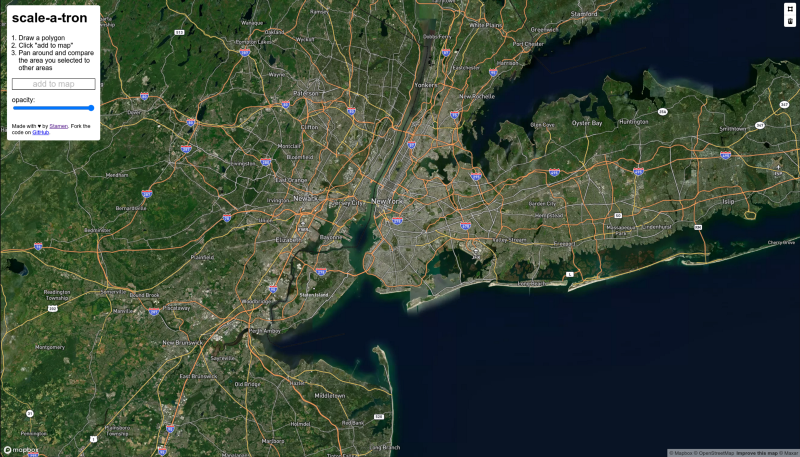
Introducing Scale-a-Tron
Eric Brelsford | 04.22.21
Roundups
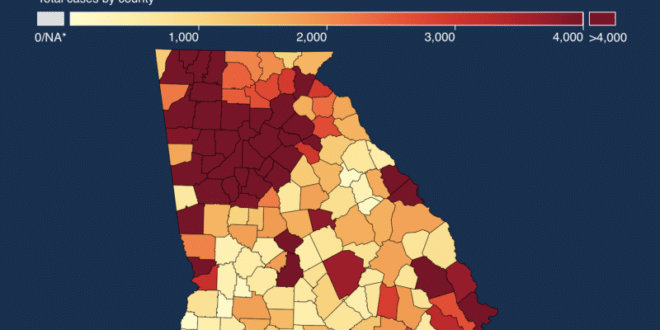
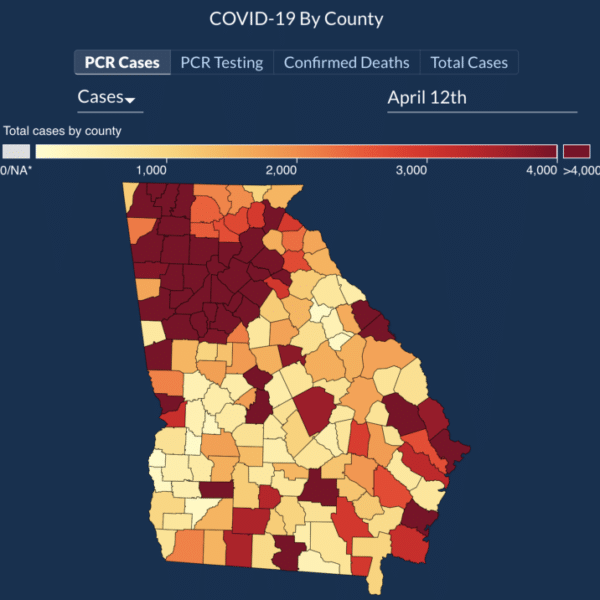
Corona-cartography: what we learned from a year of COVID-19 maps
Alan McConchie | 04.12.21
Roundups
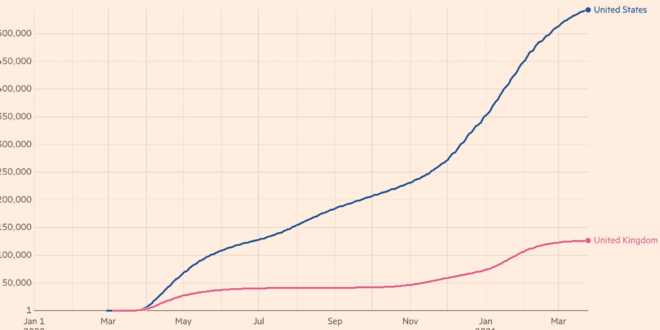
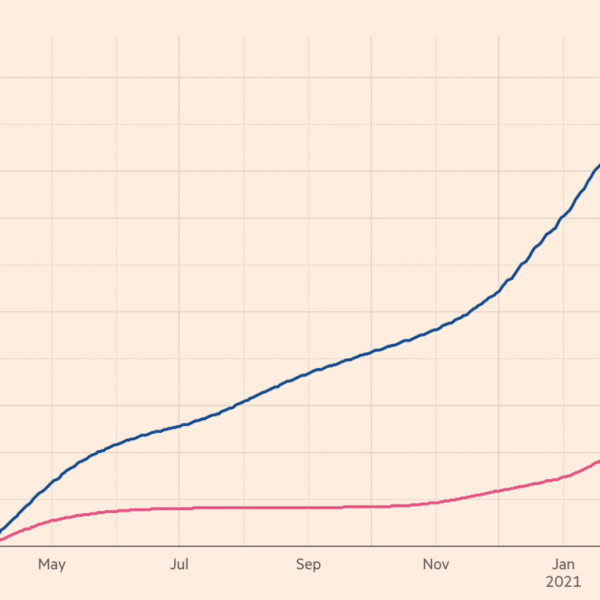
Visualizing the pulse of a pandemic: A year of COVID line charts
Alan McConchie | 03.25.21
Roundups
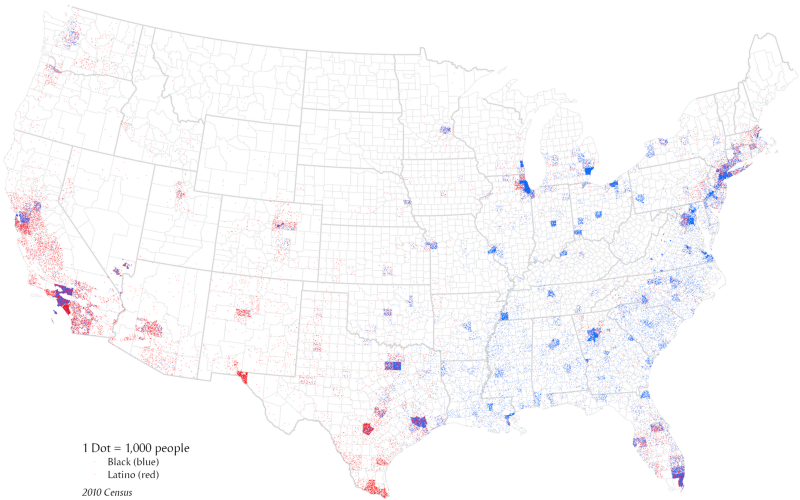
Some Thoughts on Multivariate Maps
Curran Kelleher | 03.23.21
Process
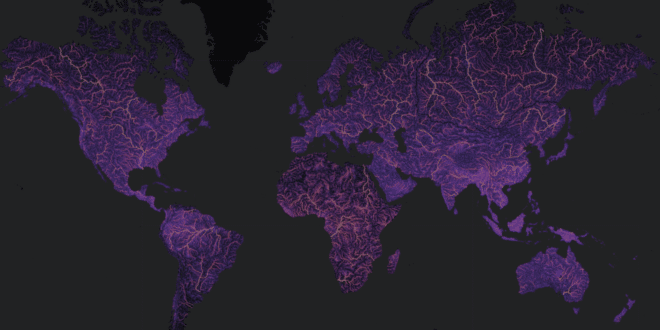
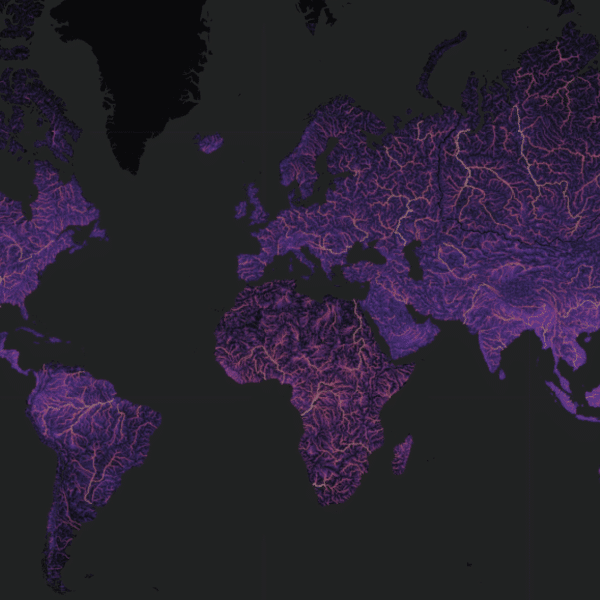
Visualizing the world’s watersheds for #WorldWaterDay
Mamata Akella | 03.22.21
Musings
Letter to a young data visualizer
Eric Rodenbeck | 03.12.21
Process
Launching the Facebook Map
Jonah Adkins
| 02.22.21
Process
Launching the Facebook Map
Jonah Adkins | 02.22.21
Close
I agree
Close
Scroll to the bottom to agree