A collection of all blog posts by Nicolette Hayes.

blog/Nicolette Hayes

What’s next for Stamen Maps?

Nicolette Hayes | 08.08.23

The Stamen map tiles have long been one of our most iconic offerings, but only recently have we engaged with how to sustainably move them into the future. In June’s episode of Pollinate we dig into how some of the headier challenges of performative materiality apply to preserving the Watercolor style in the Cooper Hewitt...

Data storytelling with respect for your audience

Nicolette Hayes | 05.26.23

Making data visual is an incredible tool for communication, but finding the right way to do so is something we are always interested in refining here at Stamen. In our latest episode of Pollinate, Denise Lu digs into what it means to distill complexity for the news cycle, and in this conversation between Stamen’s Nicolette...

Data Visualization for Education: When Asking Questions is the Answer

Nicolette Hayes | 04.26.23

While you could say that visualizing data is like providing a window into your data, we at Stamen know it’s more like building a door. Sure, data visualization allows you to see some things, but the journey doesn’t really begin until you’ve walked in and figured out where you can go next. And creating these...

Why Discovery-Driven Data Visualization Prototyping is Essential

Nicolette Hayes | 12.13.22

Non-governmental organizations (NGOs) collect and generate vast amounts of rich data. Those datasets hold power to help NGOs increase their reach by more clearly communicating their mission, vision, and results to a variety of key audiences, including funders, clients, beneficiaries, academics, the media, the public, and employees.  But as any NGO data scientist or communications...

Pollinate Ep. 3- Dan Miller, Eric Brelsford & Mapping Historical New York City

Nicolette Hayes | 02.10.22

This episode of Pollinate introduces some of our recent client work with Columbia University's Center for Spatial Research. A conversation between three members of the project team provides a deep dive into the ins and outs of using modern technology to create a historical experience centered around 100+ year old data. Dan Miller worked with Stamen’s Nicolette Hayes and Eric Brelsford to turn New York City census data from 1850, 1880 and 1910 into a fully explorable interface with enough curation and guidance to tell some meaningful stories.

Environmental Data Visualization: Many Dimensions of Lake Tahoe

Nicolette Hayes | 01.21.20

To some, Lake Tahoe represents the quintessential winter wonderland — a playground of powdery snow and stunning vistas. Others think of those famously blue waters from a different recreational perspective: a place to sail, swim, and even surf. And still others think of the 2 million year old lake as the ecological treasure lying at the heart...

Embracing the Abstract in Visualized Data

Nicolette Hayes | 07.27.16

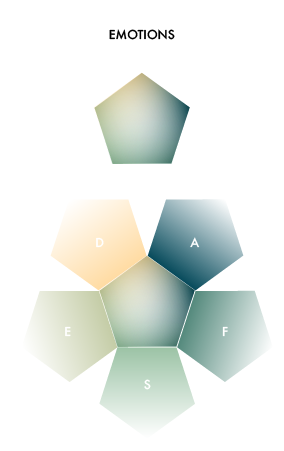
Or Tangifying the Intangible Just over a year ago I showed up to my first day as a designer at Stamen Design and was asked to distill 30 years of scientific knowledge about human emotion into an interactive visualization that would be presented to the Dalai Lama in a few months time. And then things...