learning and teaching d3 together
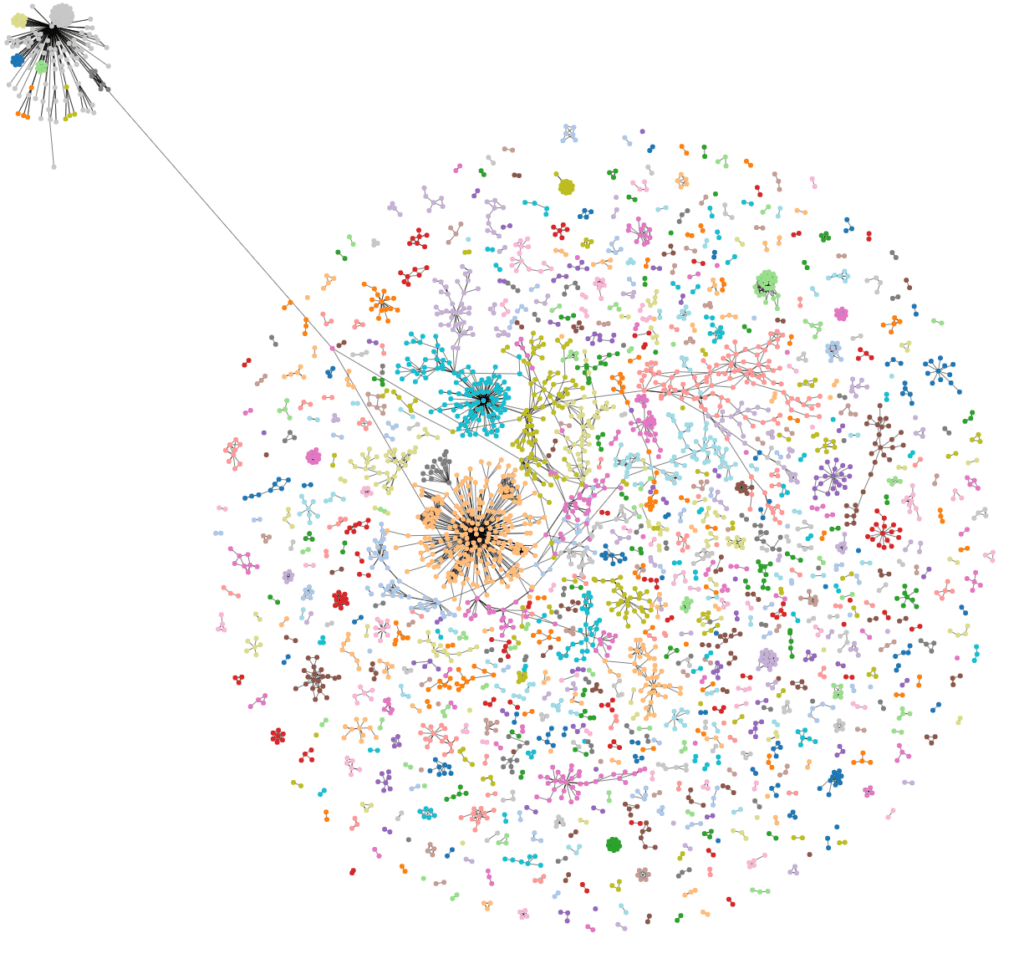
Learning d3.js and data visualization is a long and sometimes frustrating journey. First, there is the overwhelming amount of choice. From the tens of thousands of examples, to the hundreds of API functions and millions of ways you can combine them with SVG, Canvas or WebGL. Even if you can chart a course across this vast ocean you may find many icebergs lurking just below the surface. d3 on it’s own is just a collection of commonly useful functions, but it touches many technologies that have their own ecosystems, APIs and paradigms to learn. Just ask anyone who wanted to connect some data points with a simple line about the SVG <path> element and the d attribute.
So how do we help people navigate this overwhelming sea of possibilities? I have many ideas but I want to focus on a particular strategy: 1-day intensive workshops. There are tons of online resources, but nothing beats a focused session with an expert to help put everything in context. I’m convinced that a few tweaks to the traditional workshop format can create a powerful learning experience for those trying to make this data-driven journey.
what we’ve learned about learning d3
Four years of running the Bay Area d3 Meetup have given me the privilege to meet all kinds of people climbing d3’s steep learning curve. From graphic designers to backend engineers, from college students to public administration officials we’ve had all kinds of people with all kinds of backgrounds come together and try to learn this one JavaScript library. We convene to watch expert talks, to share our techniques, to practice our craft on public datasets and to learn from each other. We’ve hosted over 100 events, from small gatherings at coffee shops to 100+ people filling up auditoriums. A few patterns have stood out to me watching all these people learn.
crossroads

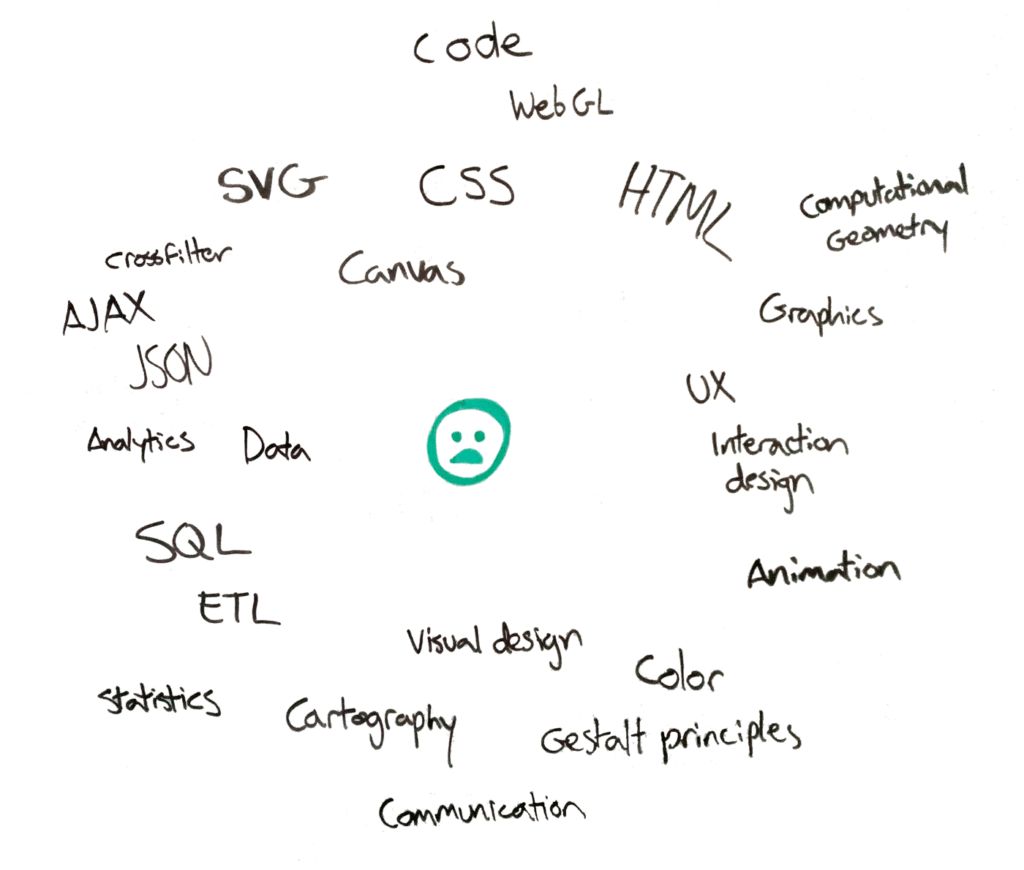
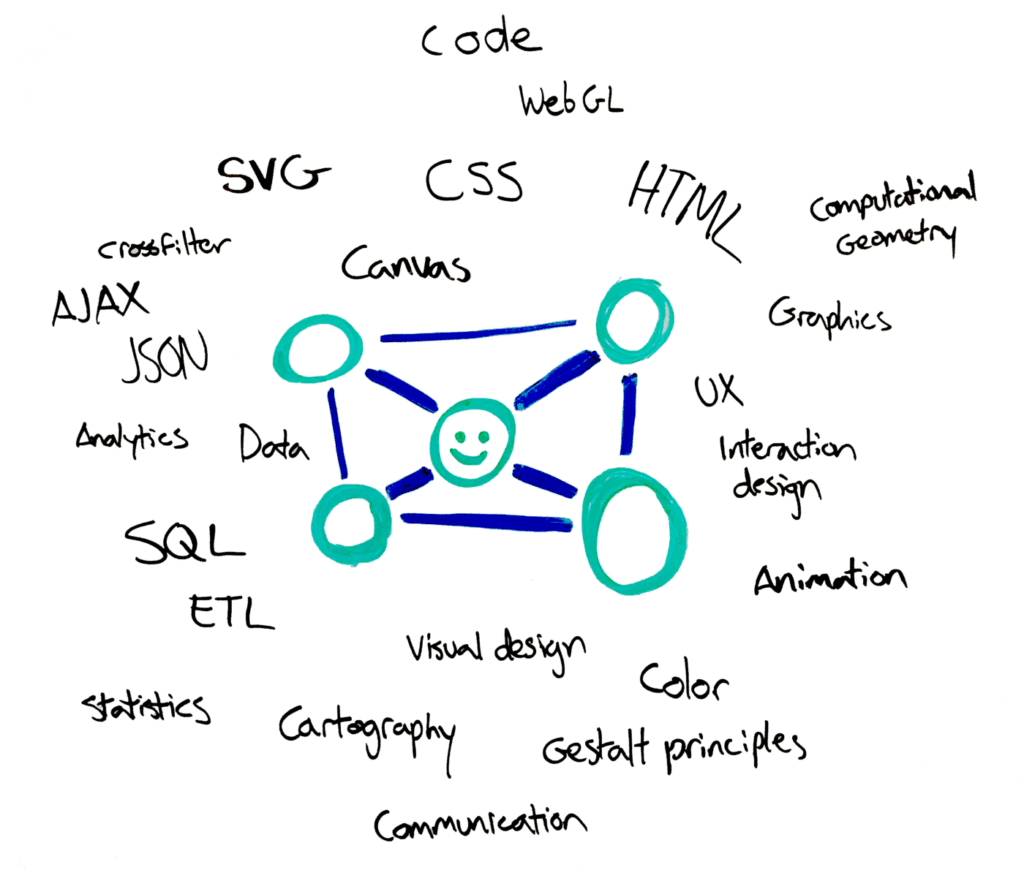
One of the most interesting aspects about d3 is that it is the intersection between design and code, math and art, data and story. It brings together people with wildly different skill-sets and perspectives who have no choice but to collaborate and learn from each other. There is just too much that goes into data visualization to have one individual master it all. While that may sound discouraging, it is actually quite exciting. Learning how to communicate with and bring together these diverse skills and talents is definitely within reach. You don’t need to become a master of everything if you know how to ask for help and where to find it.
peers over everything
We’ve hosted many inspirational speakers who show amazing projects, but the most energizing aspect of our talks tend to be the Show & Tell session at the end. We give anyone who wants to demo 2 minutes, which usually results in 5 or 6 rapid fire demos of projects at various stages of completion. These demos tend to kick off all kinds of excited discussion, perhaps it is their imperfection that makes them more accessible, or the fact that the person is stuck on something just like you are (or were) that opens up the connection. Knowing that you are not alone in on this journey is a comforting and exciting feeling, and surrounding yourself with like-minded individuals can really improve the experience.
creating an environment
Something I think about a lot when organizing d3 meetups and events is the environment we are creating. The basic formula is very simple: pick a time and place, maybe line up some refreshments and then announce the event.
The “traditional” format of one or two speakers creates a lecture environment, where the attendees consume a presentation. This creates a rather passive environment, though the socialization between and after the talks is often stimulating.
We have been iterating on another format over the years, which we now call a data dive. We still pick a time and a place and try to provide refreshments, but there are no main speakers. The environment we try to create here is a productive one, where attendees participate by spending the night coding and collaborating. We do provide some basics, like clean public datasets that can serve as starting points, or experts who can answer questions and give short tutorials. We have been pleasantly surprised time and time again by the projects that come out of these, or the progress that people make when they have a couple focused hours in a productive environment.
designing a learning experience
Recognizing these patterns has inspired us to design a new type of learning experience for learning at the crossroads by creating an environment for learning with peers. I’m imagining a series of 1-day workshop events that can be taken individually or together, each one an intense session of learning and doing.
We know that there is no shortage of content online, I’ve organized some of it for several workshops in the past. These events are not about downloading content into your brain, they are about navigating the crossroads. Each event will be a sign-post, a foothold for a specific topic or set of techniques. We will make sure everyone has context for the techniques and technologies we cover, how any particular function or concept fits in with the rest of the ecosystem.
The format for each event will be a mixture of hands-on and guided experimentation. The necessities will be provided: coffee, well-organized examples, clear reference material and more exercises than we can fit in 4 hours. We will build confidence with first-hand experience and excitement with examples crafted to produce aha moments. We will provide the environment, and the students just bring their laptops and their goals.
Perhaps the biggest departure from traditional workshops is that students are asked to apply to participate. We want to ensure that everyone in the room is a peer, motivated to learn and bringing their skills and perspective to the table. Asking people to apply adds some friction for both the students and the organizers, but we believe this is essential to create the environment we want to see. Maybe we won’t get a ton of students, but the ones we do get will define the experience.
let’s do it
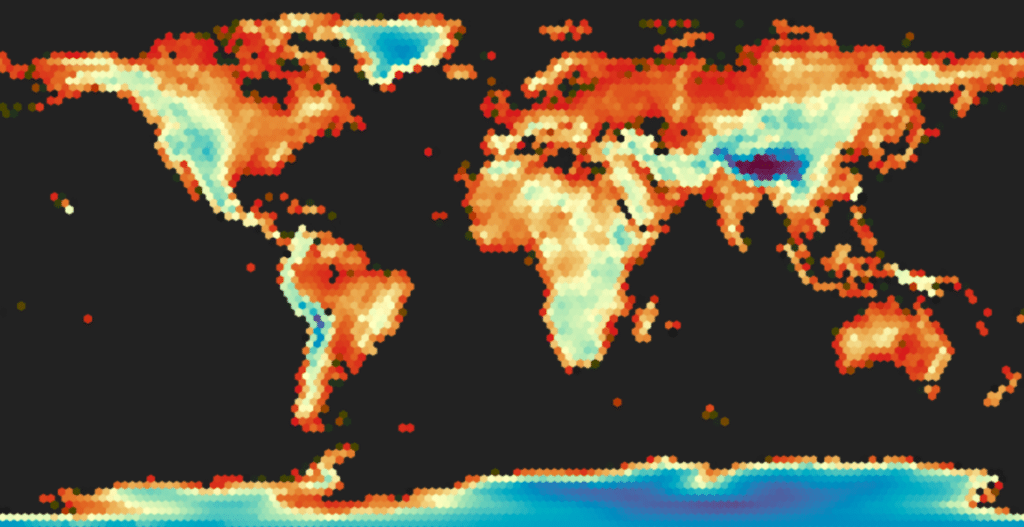
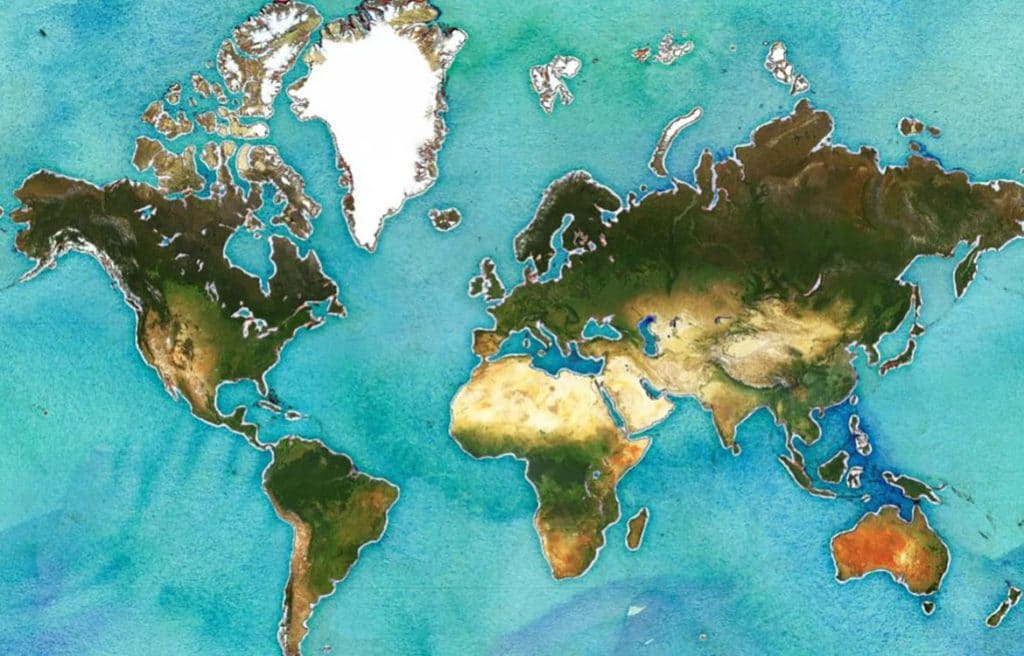
We are excited to pilot the first series of workshops with Stamen Design, a long-standing pillar of the data visualization community. The first workshop will focus on working with geospatial data, while the second workshop will focus on designing with geospatial data. Mapping is one of the oldest forms of data visualization, and creating maps has gotten a lot more interesting on the web thanks to d3.js and other tools we will cover. With Stamen’s deep experience in designing and making maps we think this is the perfect crossroad to start with.
Sign up
Be a part of the best damn learning environment we can think of!