
By: Alan McConchie and Eric Rodenbeck of Stamen Design, with Al Ramadan of Save West Cliff.
In preparation for Earth Day 2023, Stamen Design has been working with our old friend Al Ramadan to make an interactive map of the proposed West Cliff Recreation Area in the city of Santa Cruz, California. This distinctive and beautiful part of the California coast is uniquely threatened by climate change, and is a bellwether for what the rest of the coast will be facing in coming years. If we can succeed here at West Cliff, we can provide a model for the rest of California, and the world.
Why West Cliff?
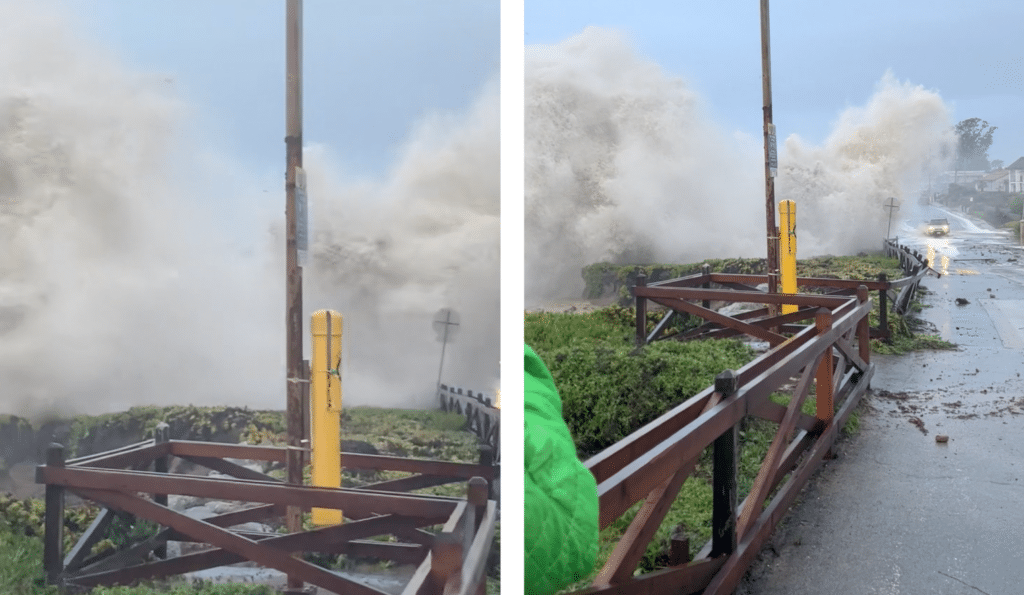
In January of 2023, a series of atmospheric rivers battered the California coast, causing significant destruction all over the place, but especially in the coastal town of Santa Cruz, and especially along West Cliff Drive. A combination of factors, including a 9’ tide and a 26’ swell, threw rocks from the beach up onto the road and did extensive damage to the road and the coast. You can see some videos of the truly massive waves that took out cars, coastline and roads here.
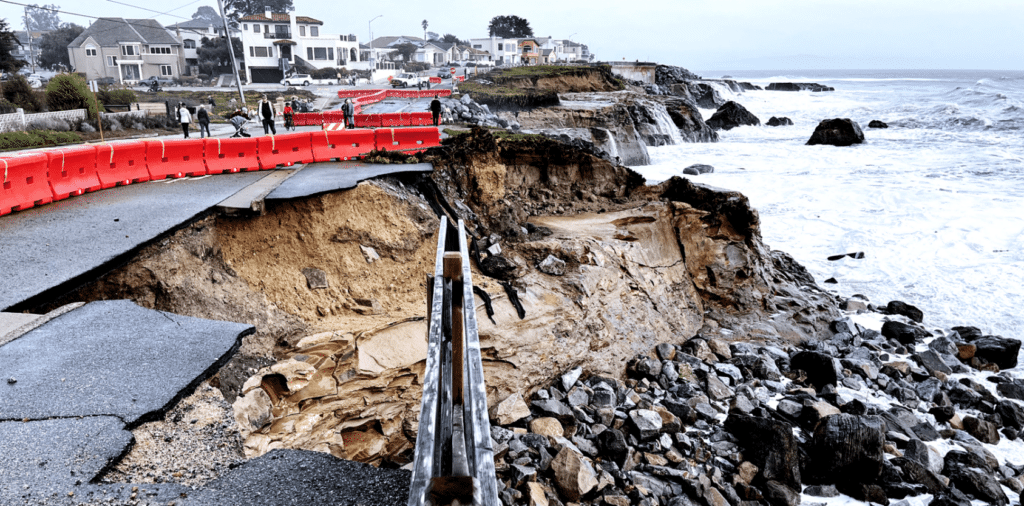
Immediately after the storm, local residents got together to form Save West Cliff, to coordinate the energy of concerned residents, surfers, joggers, sightseers, cyclists, surfers, city governments, ocean managers & others to figure out how best to respond.
Once you start to pull on this thread, you quickly realize that this is not just a question of how or whether to repair a road through a park. The thread of West Cliff connects underwater bathymetry, the Monterey Trench, changing climate, promontories, beaches, historic storms, who’s in charge of the land, who’s responsible for the water, a whole host of concerns and passions and needs all coming together in a shared love for this fantastic place and care for what happens to it.
The group has an ambitious goal: to come up with a solution that the many constituencies who care about this part of the world can get behind, advocate for, and execute. Al keeps saying “it’s not next month’s plan, and it’s not just about the road. It’s a fifty year plan, and it’s about how we manage the coast of California.” Along the way, we may just change the minds of one of the most powerful conservation organizations in the world, the California Coastal Commission. And if we can do that, it will help set the tone for every other community on the West Coast and perhaps the world.
Already, the eyes of the country are watching West Cliff, as evidenced by a story in the New York Times earlier this year.
And now! Some personal history
Eric: I was excited to hear from Al; without him, and Quokka, there’d be no Stamen. I first met Al in 1996(!) in San Francisco. He was running a hot new startup in San Francisco that wanted to do for the internet and round-the-world sailing what television had done for football: meld them together so seamlessly that it’s hard to imagine one without the other. Before Al and Quokka, world-class sailing events like the Whitbread were mainly covered on television, and it was extremely rare to get any footage of the races that were more exciting than a couple of sailboats limping in to port after performing some of the toughest maneuvers in sailing, hundreds or thousands of miles from land.
Along comes Al and some partners (including John Bertrand, who won the America’s Cup for Australia), who ask “why don’t we connect these boats to the internet?” Quokka’s work transformed sports, the internet, and me.
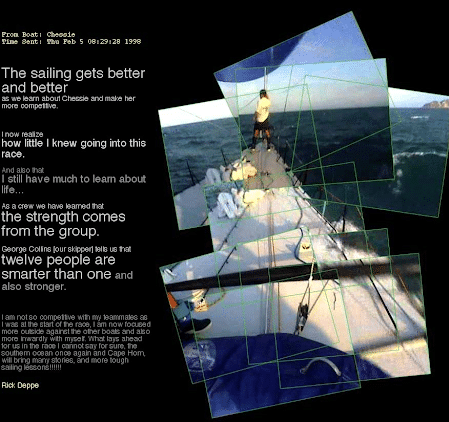
Every day when I got to work, I’d sift through the emails, videos, photographs and GPS tracks that had come in from the boats that day, and turn them into experiences that our global audiences were clamoring for, now.
It’s hard for me to overstate the impact that this experience had on me as a young designer & storyteller. For the first time, a truly global race was playing out in front of our eyes in real time over the internet. We never knew what was going to come in over the then-nascent wire, and we developed a visual and technical working style that was half template, half wacky experimental art gallery, half narrative unspooling over thousands of miles.
My three years working for Al at Quokka changed my sense of what was possible with data and visuals and the internet. A couple of years after that (and after a few false starts) I decided to strike out on my own and see if I could use those same skills on the open market, and Stamen was born.
So when Al called and told me he needed my help telling the story of West Cliff through maps, I was there. Some people you just know have got your back, and you’ve got theirs. I came down to Santa Cruz the next week for a tour, and we were off.
A vision for protecting the cliffs
Al: On October 13, 2020, The City of Santa Cruz Parks Master Plan 2030 was adopted by the Santa Cruz City Council.
The purpose of the Santa Cruz Parks Master Plan 2030 was to guide the City of Santa Cruz in parks, facilities, beaches, and open space planning on a long‐term basis. The document contains policies and actions for providing parks services and recommendations for improvements at specific parks.
The City’s Local Coastal Program has a planning item to develop a West Cliff Plan. The coastline is a recreational, natural, and scenic treasure that embodies the City’s unique sense of place and identity. A master plan could be created to guide future improvements; help maintain a more cohesive, consistent identity; and improve long-term coordination and management.
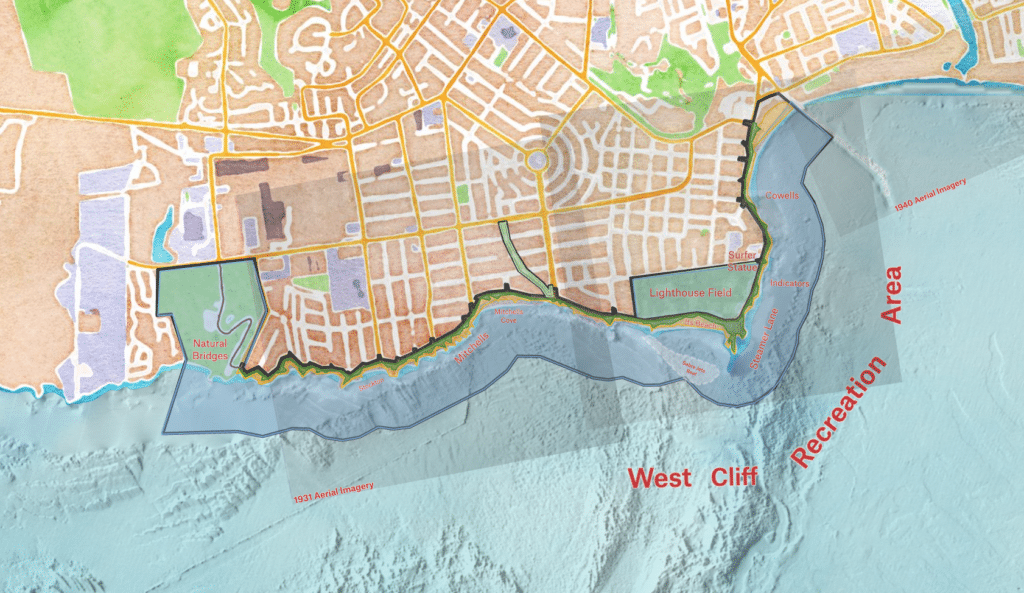
During conversations between the community and city leadership it became clear that there was a need for a more holistic map. In March 2023, Save West Cliff undertook to create a map for the West Cliff Recreation Area which included West Cliff linear park along with Federal and State parks and preserves. Members of the community used the work at Lands End in San Francisco as inspiration to create a recreation area spanning existing federal, state and city parks to create a holistic vision for the place we call West Cliff.
The West Cliff Recreation Area map was created in early April.
The vision for the map:
- Yosemite has mountains, cliffs and rivers.
- West Cliff has cliffs, beaches and Ocean.
- They both have a road running through them.
The public works discussion centered on the road and the infrastructure.
We needed to create a map which captured the love and emotion of the place Sarah Gerhardt called a “Transformative Place”
Santa Cruz is, after all, the first place surfing happened in mainland North America!
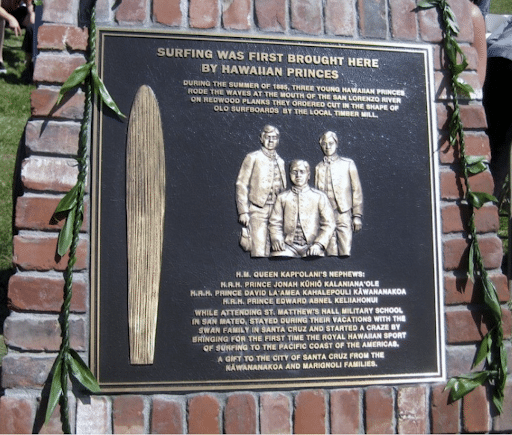
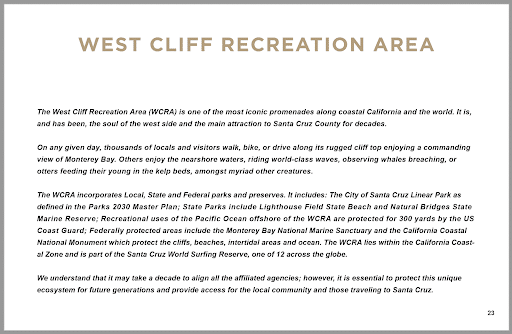
And West Cliff is, and always has been, the soul of the West Side and the biggest attraction to the County of Santa Cruz.
We had to combine the cliff top, the beaches and the bathymetry of the ocean so vital in creating the world class surf in Santa Cruz.
On top of that base map, we outlined the proposed WCRA which we defined as:
Our vision was to add layers to the map which gave people an understanding of the activities that happened in the WCRA. We added photos of people enjoying the WCRA.
Access to this unique place had to be explained. The City of Santa Cruz added layers which included vehicle access with traffic loads, stairways / Ocean access points.
We needed to explain how it related to other administrative areas such as city districts, county districts, Santa Cruz World Surfing reserve, Monterey Bay National Marine Sanctuary, the California Coastal Trail, California National Monument etc.
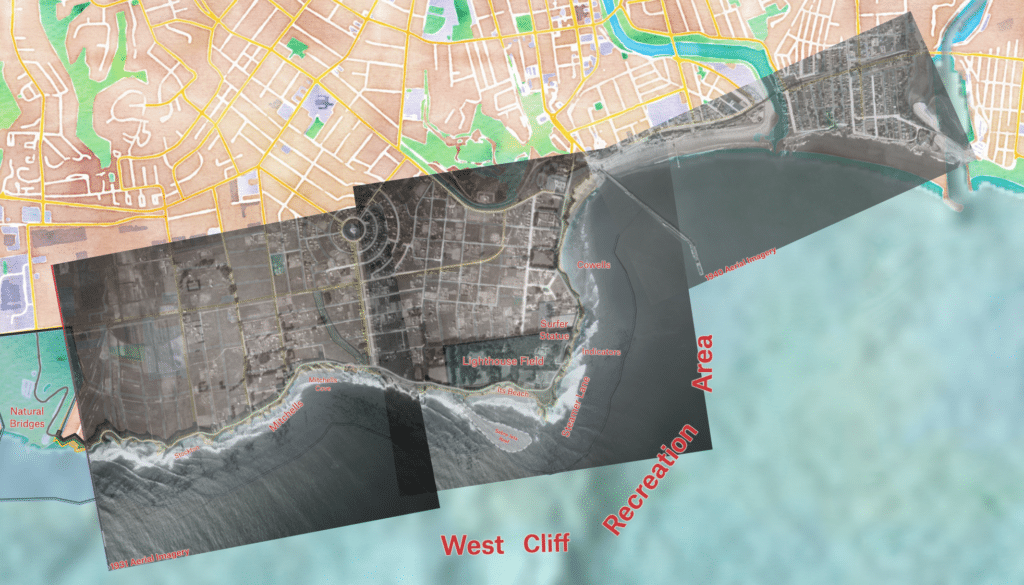
And perhaps most importantly, how West Cliff had changed over the past 100 years with overlays of digital aerial photos from 1931. By toggling between the “now” version of the coastline and the “historic” coastline, people could, perhaps for the first time, internalize the loss that the area had experienced.
We are planning on adding overlay models which show how West Storms interact with the shoreline. This makes the threat we are facing visceral and real.
And while it continues to feel like mission impossible, we needed to create a sense of hope in our mission to #savewestcliff. To do that we used a 1940 overlay of the San Lorenzo / Seabright beach area which showed how Seabright Beach which was created in 1965 protecting East Cliff and Sea Bright when the Santa Cruz Harbour was built.
In combination with the interactive Map, we included snapshots from the WCRA map in our book “West Cliff: Beloved and Iconic. A Visual Record” by Save West Cliff
None of this would have happened without Stamen.
Mapping the depths
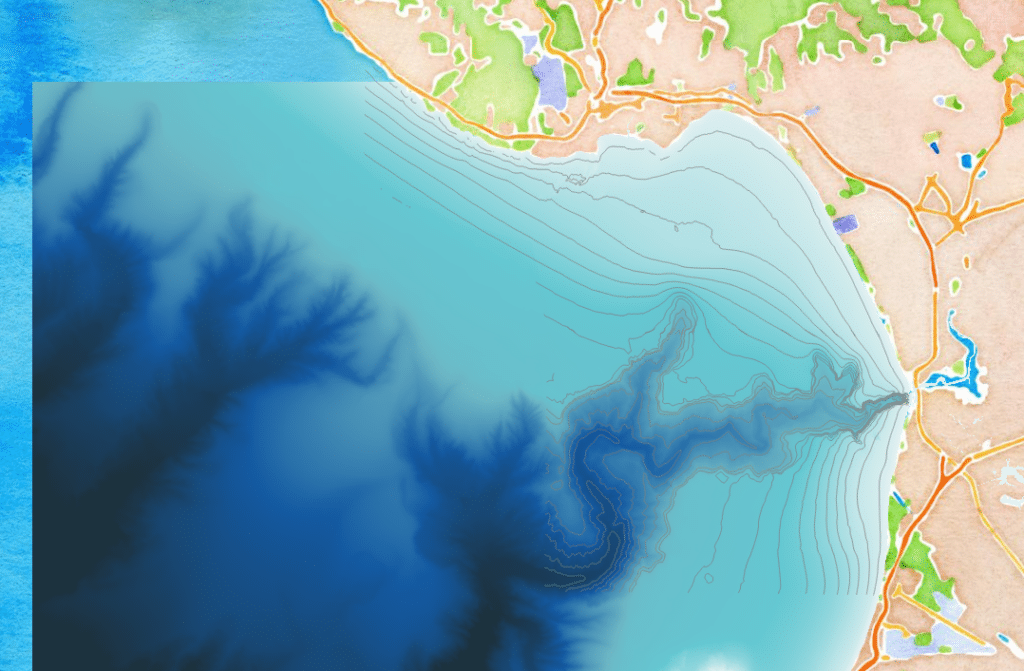
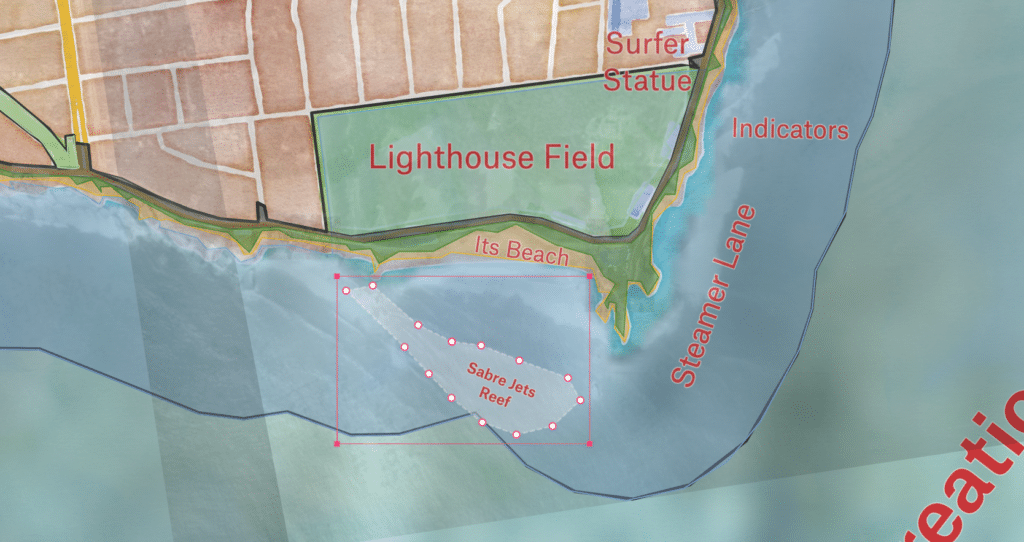
Alan: At Stamen we dove into the data Al gathered for us. One of the most interesting geographical stories we needed to tell was about the bathymetry off the coast in this area. Particularly challenging is the wide range of detail we needed to show. Right off the coast of Point Santa Cruz are some unusual undersea bedrock outcroppings that cause the formation of particularly powerful waves as Pacific swells wrap around the Santa Cruz coast from the north and west. The rest of the seabed off the shore of Santa Cruz is a very smooth sedimentary shelf extending many miles offshore, but in this one area there is more rugged undersea terrain. (For more information about the geology beneath these iconic waves, the USGS California Seafloor Mapping Program report for Santa Cruz has some fascinating geological maps and interesting details about how this bathymetry data was collected).
But despite this ruggedness, the scale of these landforms right off the coast are dwarfed by the massive chasm that is the Monterey Canyon, twice the depth of the Grand Canyon, and the largest and deepest canyon off the Pacific Coast of the US.
The trenches around Monterey Bay are extremely deep and close to the coastline, which means that deep ocean swells can propagate very close to shore without losing much of their energy. Depending on the direction of the swells, the wave interaction with the undersea terrain produces very different wave behaviors along the coast. Swells from the south produce the biggest surf in the Pleasure Point area (just east of Santa Cruz) because they can “run” up the northern arm of the trench up from Monterey Point. By contrast, the unusually devastating waves on that occurred on January 5 came from the WSW, running up the trenches west of the bay and interacting with the shallower rugged terrain just off the coast of Point Santa Cruz, undermining the vulnerable shoreline under West Cliff Drive.
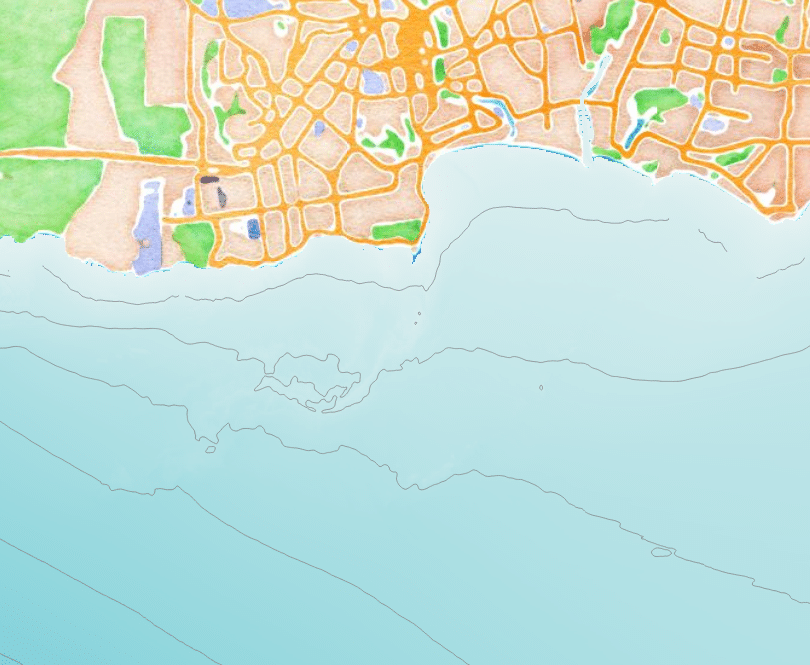
We needed a map that could show these two massively different scales at the same time. Finding a single color ramp that could do it well was impossible, and using conventional hillshades techniques didn’t work well. So instead we used a hillshade generated in Blender.
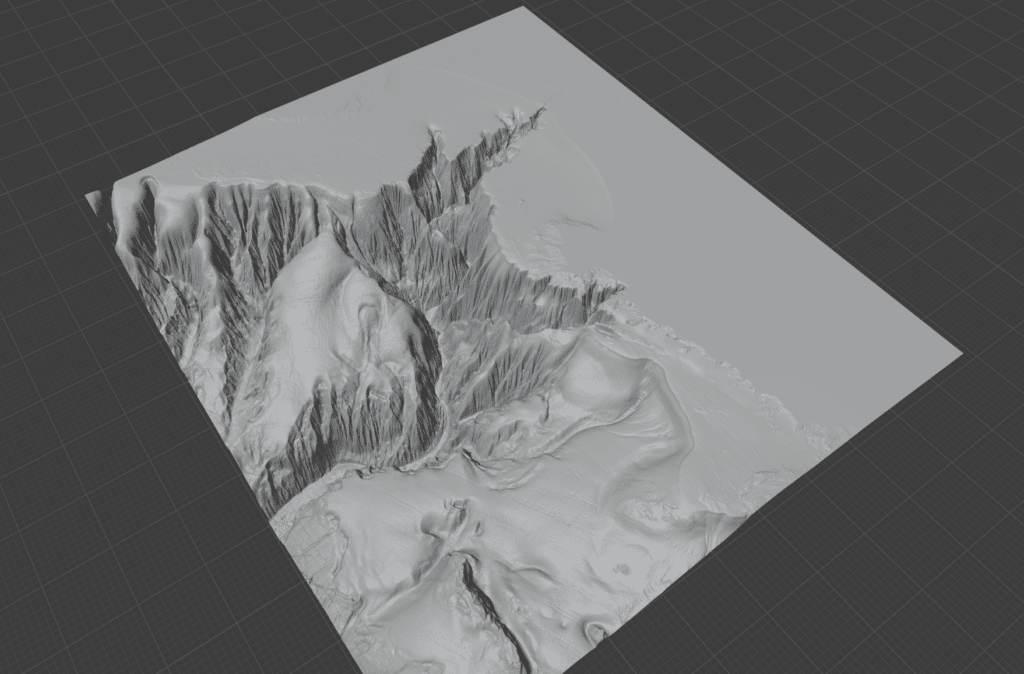
Blender-style hillshades can be beautiful, but sometimes using this style of hillshade feels like it’s just beauty for beauty’s sake (as we wrote about in a previous blog post about this new trend in terrain mapping). Making hillshades in Blender is also hard work, and not very well suited for interactive web maps. But with all these caveats, we thought that this particular use case was a situation where Blender shadows would be not just beautiful, but necessary.
Blender works by simulating a light source shining across a three-dimensional surface, casting long dramatic shadows across much of the landscape. In most cases, we think this is overkill, but here we needed some way to highlight the rich but subtle detail of those small terrain features right off the coast, and make them pop out from the contrasting smooth seabed all around them. It’s a perfect situation where a long shadow (that might otherwise obscure neighboring detail) lets us see the shape and texture of an important part of the map, while also providing detail inside the deep trench of the Monterey Canyon. A more conventional GIS hillshade technique wouldn’t have been able to serve both those needs simultaneously, but Blender could.
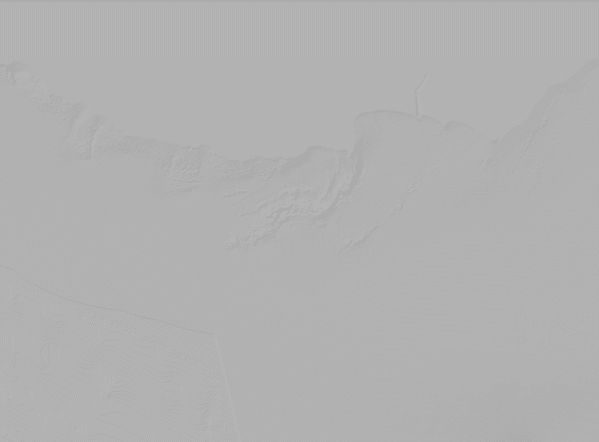
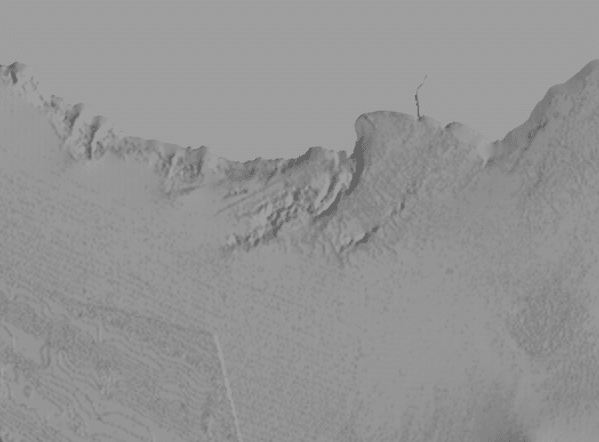
If we zoom in on the details right off the coast of the city of Santa Cruz, we can see much more structure in the Blender version:
Then in Photoshop we combined the blender shadows with a hypsometric color ramp (a color gradient showing the depth of the sea floor) to create this image, which we can use as the background for an interactive map.
Mapping collaboratively
In addition to the bathymetry layer, we needed a lot of annotations, and we also wanted to be able to show georeferenced historical photos. We also needed to be able to turn layers on and off as Al presents this map to stakeholders. And we wanted it to be easy for everyone participating in the project to be able to edit the map, regardless of their familiarity with professional design tools or the cartographic programming languages we normally use in our work at Stamen.
We decided to try out a new mapping platform we’d been hearing a lot about lately: Felt.
One very impressive feature of Felt is its ability to easily consume almost any kind of geographic file format, and just do the right thing with it. We had KML, Shapefiles, GeoJSON, imagery rasters, bathymetry rasters, etc, and we just dropped it all into Felt and “boom” it showed up in the right spot, no fussing, no complicated data conversion or reprojection, no sweat.
Felt also supports collaborative editing, meaning that our collaborators (Al in particular) could just jump in and immediately start modifying the shapes of parts of the proposed Recreation Area, or adjusting the color or line weight of the styling, or drop in their own photos and realign them on the map.
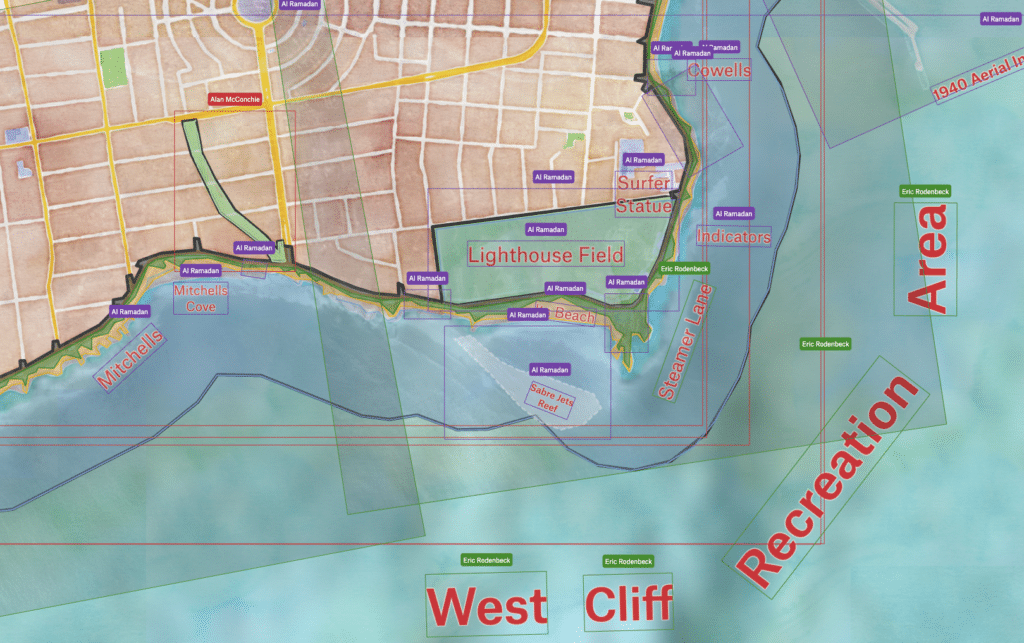
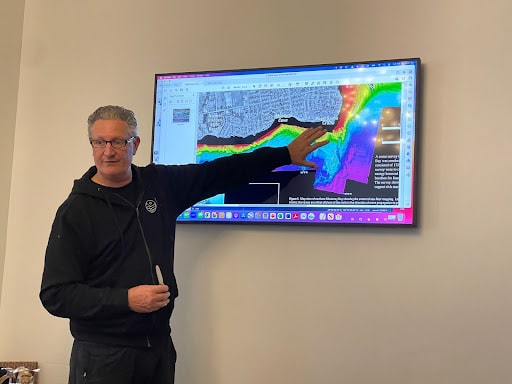
Felt is also strongly oriented toward being a presentation and storytelling tool. We were able to add our own annotations right on the map, and easily zoom and toggle different layers as needed as we walked through the salient features of the proposal during presentations to stakeholders like the Mayor of Santa Cruz.
You can view our Felt map here: Santa Cruz: West Cliff Recreation Area.
And for things that Felt can’t do (yet), we did a lot of work in QGIS (and Blender, as described above) and loaded up our own custom raster and vector layers as needed. It’s a beautiful platform, but like any platform, it has its limitations and its own project life cycle. At Stamen we’re very often called in when people using these platforms have reached the limits of what they can do, so it’s a comfortable place for us to be. If you need this kind of help, do say hello.
Next Steps
So the map is almost ready, and Al & co are gathering their forces for a City Meeting at London Nelson Community Center on Thursday, Apr 27, 2023. You can learn more about this community meeting on the City of Santa Cruz website, and we will update this post with more details when they’re available.
I suspect this isn’t the last we’ll hear of this project, and it’s not like the conversation around sea level rise and coastal erosion in California is going to slow down. Stay tuned!