
What insights are lurking in your data? What stories could you tell if you could transform your dull tables and spreadsheets into lively, interactive, and beautiful graphics and visualizations?
Sign up for our Data Visualization Foundations workshop, and we’ll help you learn to create your own data visualizations through hands-on, in-person instruction! This two-day workshop — hosted in our San Francisco studio on July 21 & 22 — will help you build data visualization literacy and get you started building your own visualizations using cutting-edge tools.
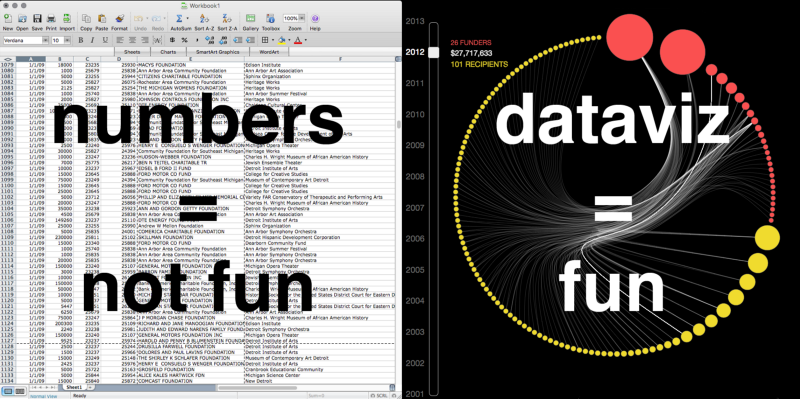
We believe that students learn best when they’re working on subject matter that they’re familiar with and is directly relevant to their lives. That’s why we encourage you to bring your own data to our dataviz workshops. Maybe you have a tricky problem at work that a good visualization could help you figure out. Or maybe you want to make a beautiful chart from some personal dataset as your weekend project. Whatever it is, we can help you explore your data and figure out what type of visualization works best.
Got questions about whether this class is right for you? Or maybe you have suggestions for future workshop topics? Drop us a line.
What classes are coming up next? We’re currently developing a new workshop called Data Visualization for Climate Change, which we will launch around the time of the Global Climate Action Summit in September. This intermediate workshop will build on the material in the Foundations class, exploring common data visualization types through specific examples related to climate change. We will work on time series visualizations of indicators like temperature and CO₂, and maps of sea level rise, natural disasters, and more. Want to be the first to hear about it when tickets go on sale? Sign up for our announcement list here: http://eepurl.com/cxbWRf