Introducing the Seattle Building Emissions Performance Standard (BEPS)
Policy is one of the most effective tools in creating a greener planet, and yet it is meaningless without action. The Seattle Building Emissions Performance Standard (BEPS) is a policy aimed at reducing greenhouse gas emissions from buildings in Seattle. It is part of the city’s broader effort to meet climate goals and achieve carbon neutrality by 2050. Depending on building type, BEPS sets a series of benchmarks to achieve emission reduction goals, and failure to do so results in fines and penalties. Like all of us, building owners and managers are often quite busy, so sorting through new ordinances and rules can be overwhelming and create a sense of frustration that clouds the goals of those policies.
City of Seattle brought in Stamen and our friends at GreenInfo to help bridge the gap between the city’s energy goals and building owners action on these goals. Several years ago, we created the first version of Seattle Energy Benchmarking Map building off of the City Energy Project map, allowing cities like Seattle to visualize energy efficiency of buildings across their metros using standardized data types. Users can view and sort buildings by total greenhouse gas emissions, energy use intensity, and compliance with local energy performance standards. With the introduction of the new BEPS ordinance, City of Seattle reached back out and asked us to redesign their Building Report which can be accessed from the map view. Our goal was to create a user-friendly resource for building stakeholders to be able to understand and take action on the necessary requirements to fulfill BEPS and other city ordinances.
Collecting feedback from stakeholders
Adding BEPS information was, as we saw it, also an opportunity to streamline the existing report such that we could amplify the user experience as a whole. As any creator likely feels about their work, we certainly had some ideas about what we could do better or differently with a second iteration, but we mostly wanted to hear from our users themselves. The best way to get a sense of the effectiveness of the current building report is to hear from our stakeholders that use and/or are close to those that use the report directly. We sent out a survey and held a session to collect feedback on what existed and was missing from the report.
The biggest takeaway from our feedback session was that the information needed to be understandable from a glance. Our stakeholders made it clear that dealing with yet another ordinance can feel daunting for the report users. They really just want to know if they need to take action and how to do so. There are two main ordinances that a building may be concerned with: BEPS, which pertains to multifamily and non-residential buildings greater than 20,000 square feet in the City of Seattle, and Washington Clean Buildings Performance Standard (CBPS), which pertains to commercial buildings greater than 50,000 square feet in Washington state. We would also feature historical building data and ensure that there were clear places to learn more about either ordinance for report users.
Organizing the information
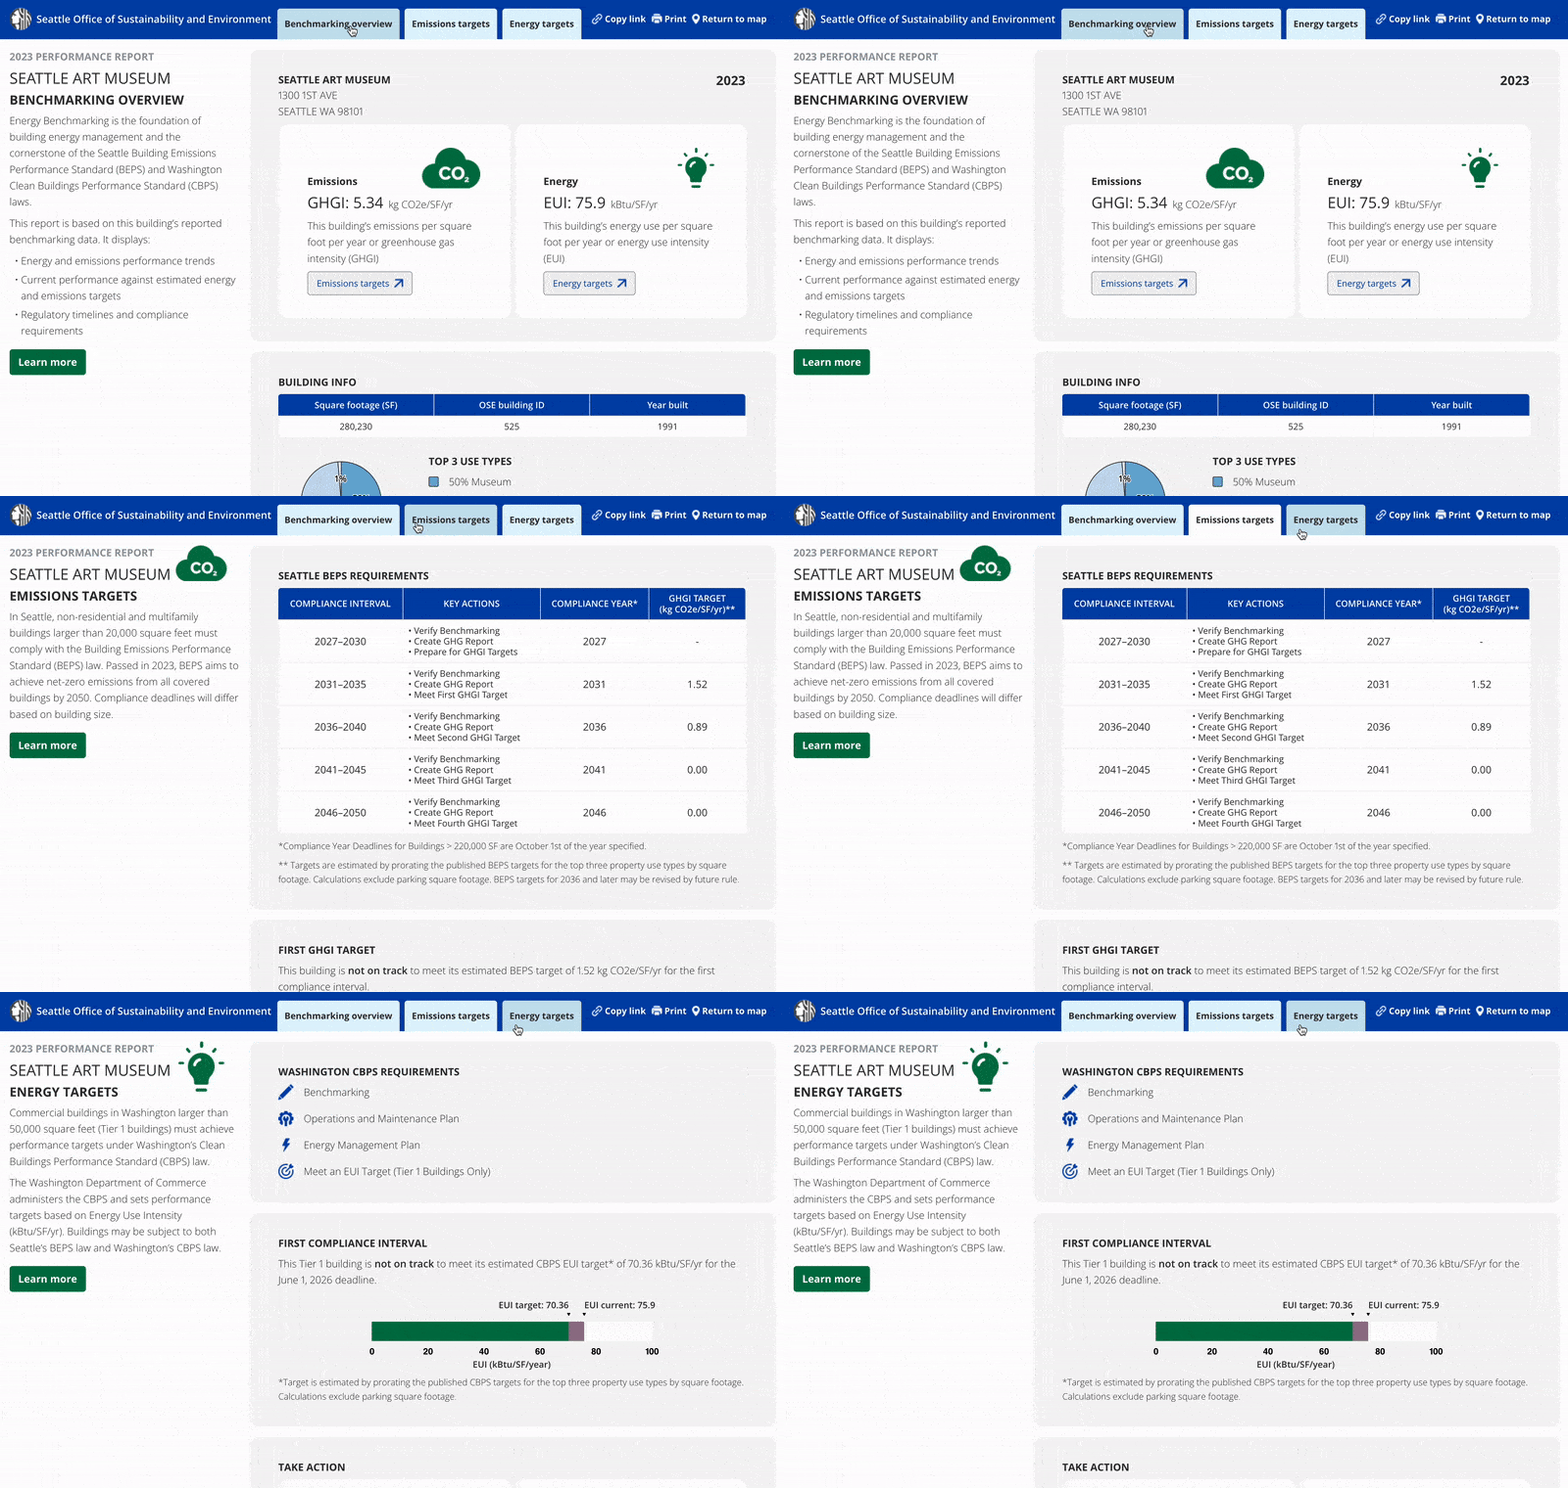
We overhauled the current structure of the report to create three separate sections:
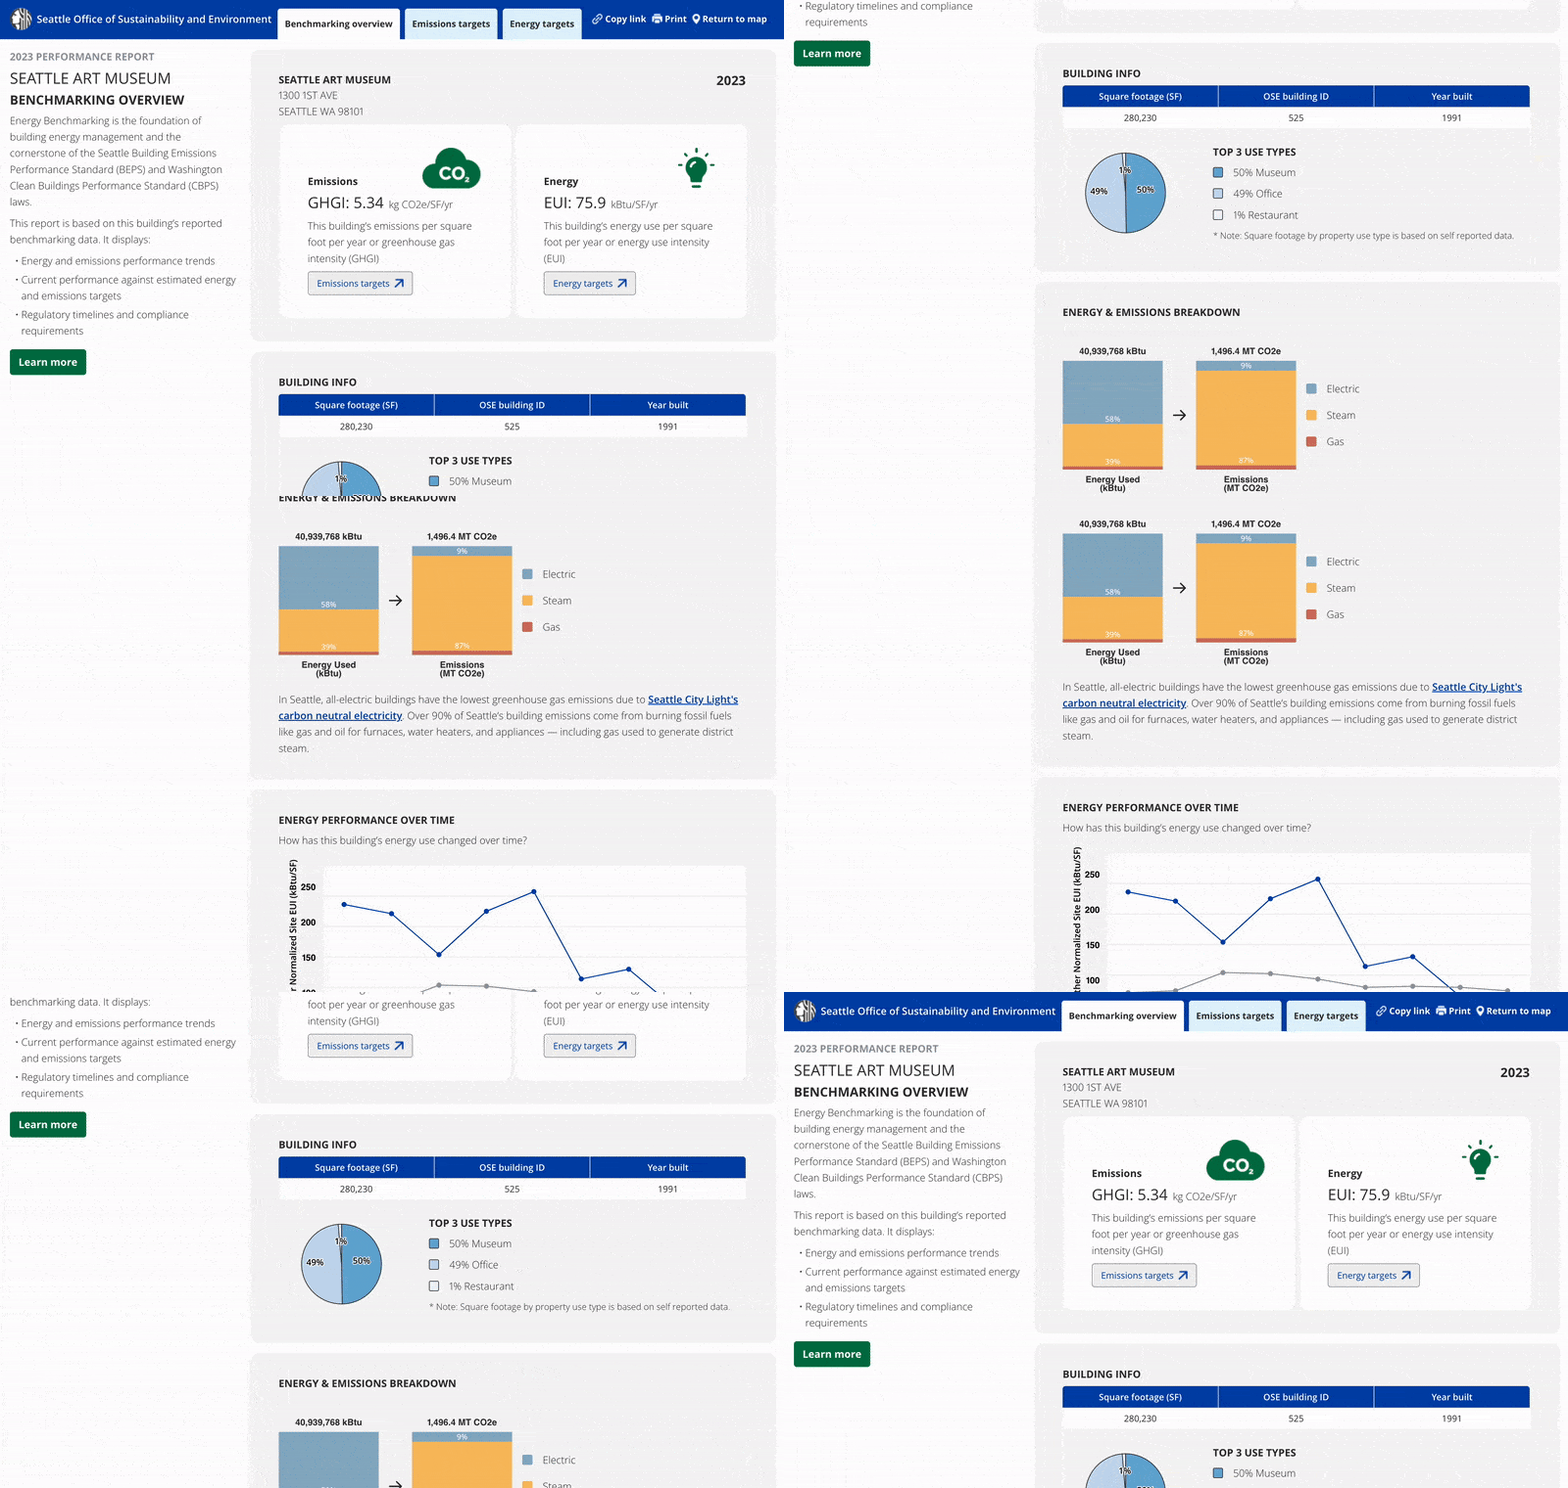
- Benchmarking overview that features emissions and energy metricsand includes historical information to set the stage
- Emissions targets that outlines BEPS timeline and current actions
- Energy targets that outlines CBPS timeline and current actions

The original report was meant to primarily be viewed and printed as a PDF, so it was formatted to be read as a report from top to bottom. Based on our feedback session, we felt that our users were more likely to view the report in the link itself, so we divided the report into three sections to reduce overwhelm when you first arrive. Each section is structured the same with background information on the left and a scrolling list of data visualizations related to the section on the right. “Learn more” buttons allow the user to find external resources. They may copy a link to the building and page currently in the viewport to share or save for later. Users still have the ability to save and print the document as a PDF if they prefer.

Designing the data visualizations
There was plenty of relevant data like emissions and energy usage, relevant timelines, building type, historical usage, and more to visualize, so we first outlined our data visualization goals:
- Clear and understandable at a glance
- Reuse forms where possible and relevant
- Adaptive to changing timelines and new data
- Effective in website form or as a printed pdf
- Accessible and colorblind-friendly
We opted for a loud and clear statistic to display the most important information: emissions and energy usage. At the end of the day, we agreed that the most at a glance way to receive this information was a large number. The BEPS ordinance requires buildings to reach greenhouse gas intensity (GHGI) targets through lowering their emissions and the CBPS ordinance requires covered buildings to hit their energy use intensity (EUI) targets by reducing their energy usage. We used iconography that is repeated throughout the report to help users track and distinguish between the emissions data (CO2 cloud icon) and energy data (lightbulb icon). Buttons to learn more about the targets related to each value allow users to quickly access more information.

From the statistics, it’s likely that a user would move to the Emissions Targets (GHGI) or Energy Targets (EUI) specific page to dive deeper. We created progress bar visualizations that contextualize the GHGI or EUI data in reference to the next relevant target. The progress bar is effective because it focuses on the current goal and is framed by a statement of whether the building is or is not on track to meet its target. We opted for a green/purple color scheme here for colorblind-accessibility and used a green pattern for the wiggle room a building might have when its currently meeting its target.


We also created a series of visualizations included in the Benchmarking Overview tab that provides information on the building itself and historical building energy and emissions data. We used a stacked bar graph to show how types of energy used converts to resulting emissions. With colorblind accessibility in mind, we chose colors based on the energy type, i.e. electric is a friendly blue and gas is a dangerous red. We kept the line chart from the original Building Report that shows historical energy use over time in relation to an average building. While this visualization is interesting, it is one of the last graphs on the page as historical energy usage can be misleading depending on factors such as dramatic building usage changes due to factors such as growth or COVID-19.


Last but not least, we needed to convey all the relevant information around benchmarks and deadlines related to the BEPS ordinance. There are a series of key actions building owners need to take for each compliance interval to achieve their GHGI target by a certain date. While not the most glamorous visualization, we created a simple table that does just that. When it comes to finding timeline information effectively, a table is a form we use in our daily lives all the time. It was the simplest way of communicating the bulk of information most clearly to our users.

Bridging the gap between policy and action
We here at Stamen love working with data that helps people make the planet cleaner and more energy-efficient. Any dataset or policy can only go so far without the right kind of framing or storytelling that empowers users to take action. If you have any data or problems related to this or anything else really, please reach out!
