blog/Design

Stamen at NACIS 2023: A Recap of Creative Cartography and Community

| 11.06.23

The North American Cartographic Information Society (NACIS) 2023 conference in Pittsburgh was a fantastic gathering of cartographers, mappers, and map enthusiasts. Stamen was well-represented this year by Kelsey Taylor, Eric Rodenbeck, and Ross Thorn. I’m developing a history with NACIS, having given my first talk there last year on cartography and the golden ratio, and...

Stamen x Stadia series: Terrain behind the scenes

| 10.17.23

When we started thinking about how to recreate Stamen’s iconic Toner and Terrain raster styles with vector data, Toner seemed like it would present the bigger challenge. Achieving the right hierarchy and visual balance of that style felt like a monumental task to me, an ardent admirer of Toner for many years. Terrain was less...

Stamen x Stadia: harnessing modern vector cartography

Not long after Stamen created our first Toner, Watercolor, and Terrain styles, a new technology came along: vector maps. Though it still used the paradigm of dividing up the world into map tiles, vector maps divide up the data into pre-processed chunks instead of the map itself. In vector cartography, the map is drawn dynamically...

Dreamy, aspirational cartography with Spherical

| 08.10.23

Earlier this year, Stamen collaborated to design a custom branded basemap with our friends at Spherical, a creative technology design and integrative research studio supporting projects regenerating the health and integrity of Earth’s living systems. In partnership with ARLA, Spherical supports community workshop facilitators with their Living Infrastructure Field Kit, a space to explore the...

The Data Visualization Discovery Phase Made Clear, Clear, Clear, in Business Language!

| 06.12.23

Mention the term “discovery phase” in a room full of product managers, analysts, executives, entrepreneurs, or developers, and you’re certain to garner myriad responses: everything from nods of agreement and appreciation to rolling eyes and exasperated sighs. In fact, in the design and development process of digital products, there’s perhaps no phase that is more...

Data storytelling with respect for your audience

Making data visual is an incredible tool for communication, but finding the right way to do so is something we are always interested in refining here at Stamen. In our latest episode of Pollinate, Denise Lu digs into what it means to distill complexity for the news cycle, and in this conversation between Stamen’s Nicolette...

Cartographers Play Video Games – A Review of the Map in The Legend of Zelda: Breath of the Wild

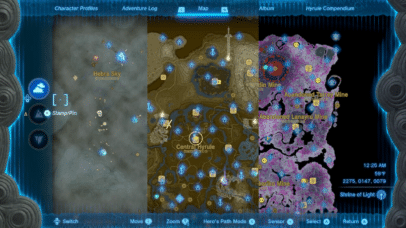
At Stamen, our appreciation and opinions of maps go beyond just our professional work here and often bleed over into our personal interests as well. Our eye for interactivity, color palettes, contour lines, and labels doesn’t stop once we log off at the end of the day. As we covered in a previous post by...

Data Visualization for Education: When Asking Questions is the Answer

| 04.26.23

While you could say that visualizing data is like providing a window into your data, we at Stamen know it’s more like building a door. Sure, data visualization allows you to see some things, but the journey doesn’t really begin until you’ve walked in and figured out where you can go next. And creating these...

Weaving together plants and people: developing a touchscreen installation for the Exploratorium

| 04.04.23

¡Plantásticas! is now open at the Exploratorium! This exhibit introduces visitors to the world of plants through a diversity of perspectives, and features an installation by Stamen design. The Exploratorium came to Stamen with two rich sets of data: the lived experience of plants through the eyes of Latinx and Indigenous communities, and high resolution...

How we use collaborative design software to collaborate on more than just design

If you had the opportunity to visit the Stamen studio during our twenty-year reign at the corner of 16th and Mission you’ve probably noticed how integral collaboration is to the fabric of our business. Project teams huddled in a meeting room, whiteboard sketches happening in another, spontaneous hallway conversations, or our daily meals together around...