
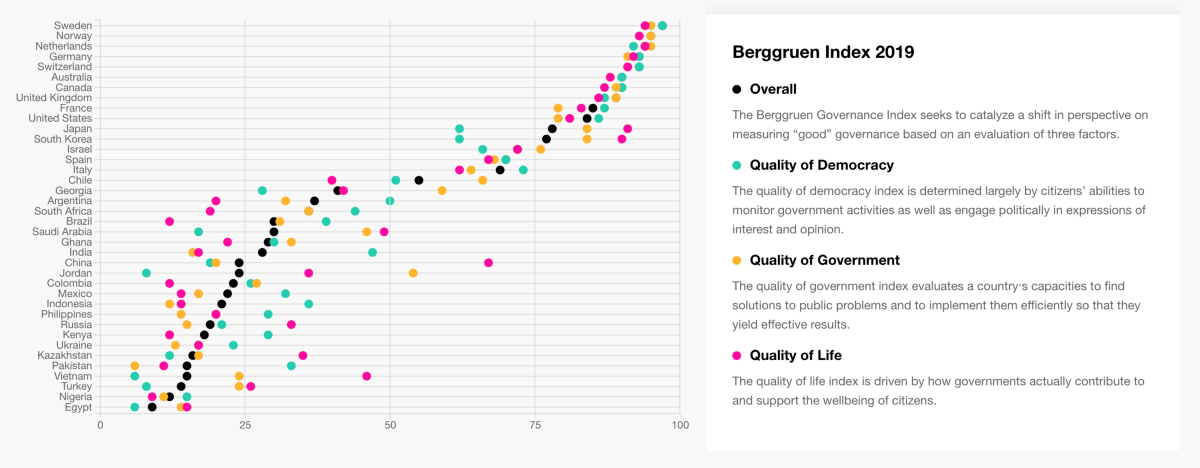
The Berggruen Institute came to Stamen with the goal of bringing a fascinating global dataset to life: its Governance Index, which offers important insights into what makes a good government. The Index explores the relationship between democratic feedback, government competence, and the provision of public goods as measures of a good government.
Over six years in the making, the Index evaluates the governance of 38 countries based on quality of democracy, quality of government, and quality of life. The Stamen team — Design Technologist Marc Schroeder, UX Designer Sam Vogt, and Program Director Jaleen Francois — built interactive data visualizations of the Index that helped Berggruen illuminate this important story.
Jaleen Francois chatted with Dawn Nakagawa, Executive Vice President at the Berggruen Institute, to shed some light on this collaboration and its importance.
Jaleen Francois: What does it mean to the Berggruen Index to have an interactive tool to explore your data?
Dawn Nakagawa: It means deeper understanding — among those who care to explore — of what functions and capabilities of government matter most for producing good quality of life for citizens.
JF: Why now?
DN: Mostly because it is ready, but more generally because it’s timely. The Berggruen Governance Index informs our analysis of the current crisis of democracy. Governments’ inability to deliver improvements in quality of life, and in the case of the US, has overseen a decline in wealth and health for some segments of society, is challenging the legitimacy of democracy as an effective form of government. The Index sheds light on that.
JF: If you could describe the impact that you’d like this work to have on your audience in one sentence, what would that be?
DN: To help deepen understanding of why effective government matters.
JF: Was there anything about this project or the process that surprised you?
DN: How long it took. Not the interactive site — that was fast and painless, thanks to Stamen. But the Index took 6 years to develop. It takes years to build robust data tools.
JF: This tool is the first of its kind for the Berggruen Institute. Has working on an interactive data project changed the way you think about helping people engage with your work?
DN: Not really. I have long understood the magic of fun, useable data tools. What has changed is my perception of how hard it is to build an interactive site. I had the misperception that it is hard, but it really wasn’t.
JF: Anything else you’d like to mention?
DN: Thank you to Eric, Jaleen and the Stamen team!