
Every year in November, cartographers around the world take part in the 30 Day Map Challenge, spending their free time creating a new map each day, working through a list of different prompts posted by organizer Topi Tjukanov, and sharing their maps on social media at the #30DayMapChallenge hashtag.
This year, watching the stream of maps go by has been bittersweet, not only because we at Stamen are too busy to join in the fun, but also because this is likely to be the last year we’ll be seeing scores of cartographers picking up and experimenting with Stamen map tiles. Unfortunately, the cost of maintaining this service is quite high, and we have not been able to get sufficient sponsorship from open source programs or financial support to maintain this service through 2023.
Stamen’s cartographic influence is apparent in many of the online submissions to the challenge. For over a decade, Stamen has provided several free basemap layers built on OpenStreetMap data, all made available under a Creative Commons license for any members of the public to use in their maps. The Watercolor map style is so iconic that it was inducted into the Smithsonian last year. Our Toner style inspired two vector tile versions: MapTiler’s port of Toner to the OpenMapTiles schema, and Refill, a customizable successor to Toner lovingly hosted and maintained by Nextzen, who also hosts a more updated version of Terrain.
And yet, the original recipe Stamen map tiles still get a lot of love! Once you start looking for them, you see our raster basemaps showing up in a surprising number of #30DayMapChallenge maps.
In a lot of ways, our basemaps have made projects like the #30DayMapChallenge accessible to many more people who wouldn’t otherwise have had the time or the skills to build an entire map from scratch every single day. Because cartographers can get started creating a map based on these existing map tiles, they can focus on the topic of their map at hand much more easily and quickly.
We are pleased to see our basemaps continuing to have such a long and critical role in the mapping ecosystem, we want to make it clear that these maps are definitely showing their age. We are a small design studio, and hosting these basemaps costs us a significant amount of money each year. Furthermore, we don’t have the time to give them the updates and maintenance that they deserve, making these services increasingly out-of-date and unreliable even as other alternatives proliferate.
In the meantime, we are pursuing every avenue we can to protect and preserve the legacy of these tiles. If you’ve got ideas on how to support these tiles and you want to get involved, please get in touch with us!
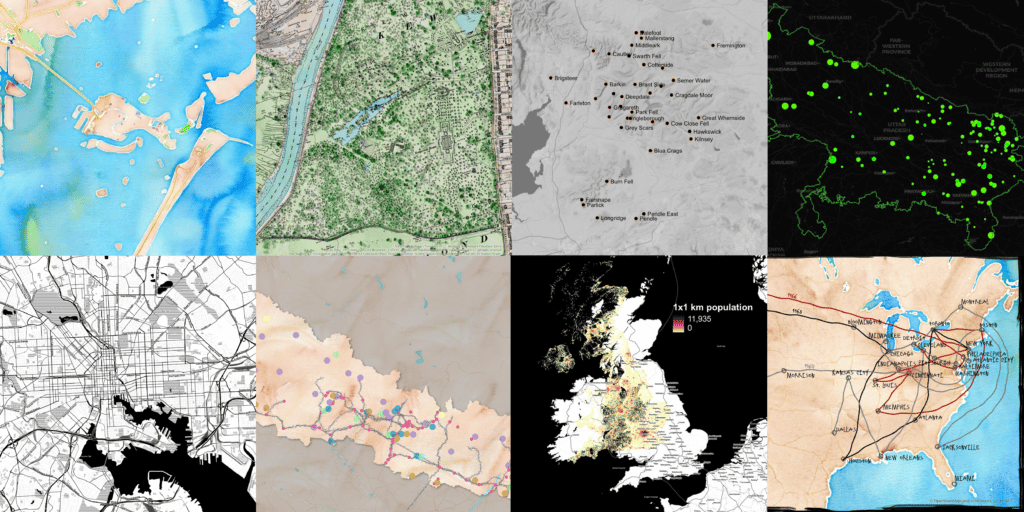
You’ll be hearing more from us in later blog posts about Stamen’s more current tools, workflows and offerings, but for now let’s just enjoy some of the interesting maps people made with our tiles during the month of November:
Day 1: Points
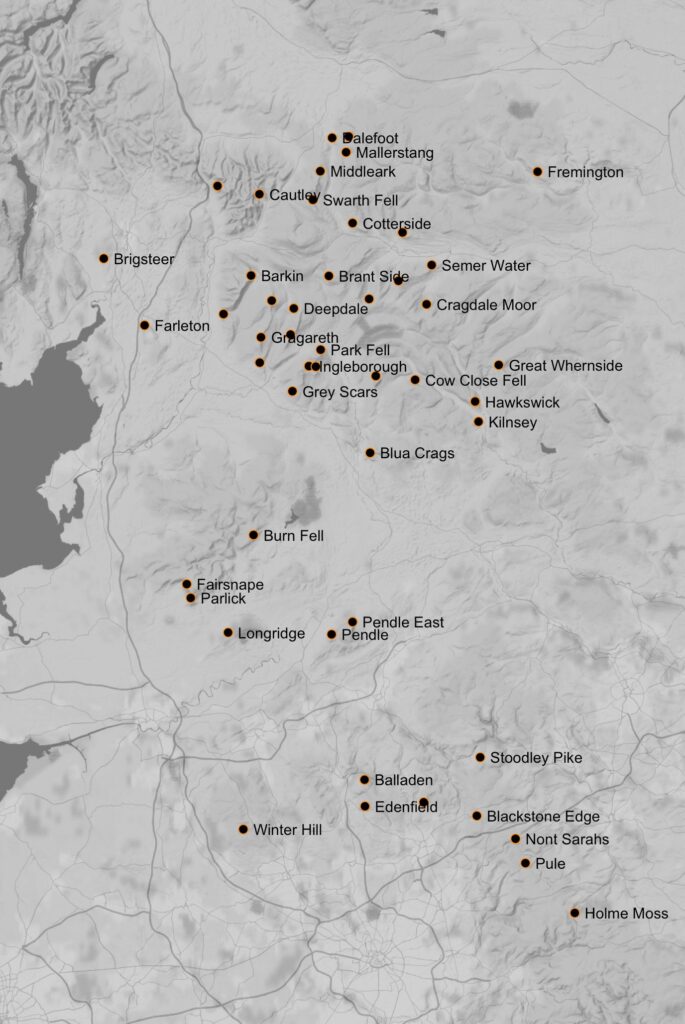
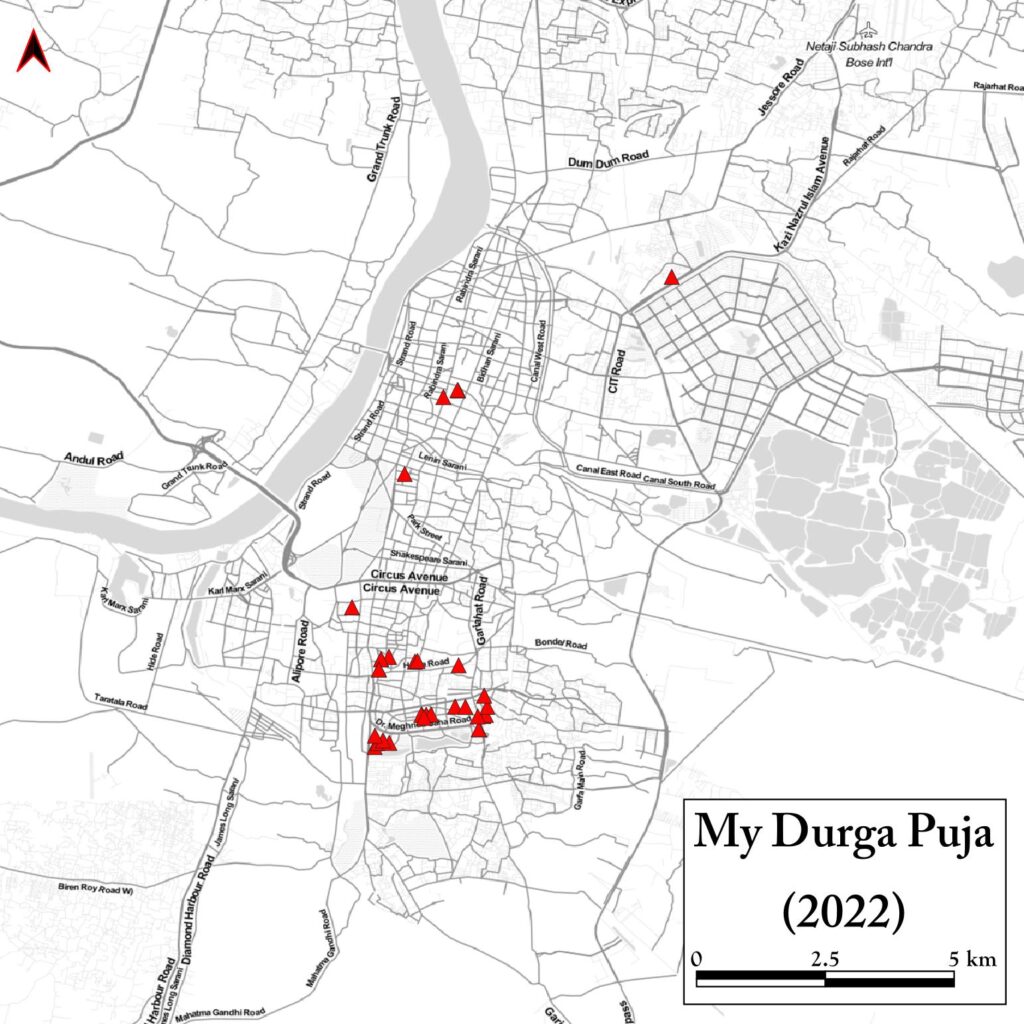
On day one we saw some very different maps on the theme “Points”. Neil Charles used a desaturated version of Stamen Terrain and the R visualization software to make his map of paragliding hills in the Pennines and Yorkshire Dales, while Shashank Srinivasan used Toner Lite in QGIS to map pandals in Calcutta:
Day 2: Lines
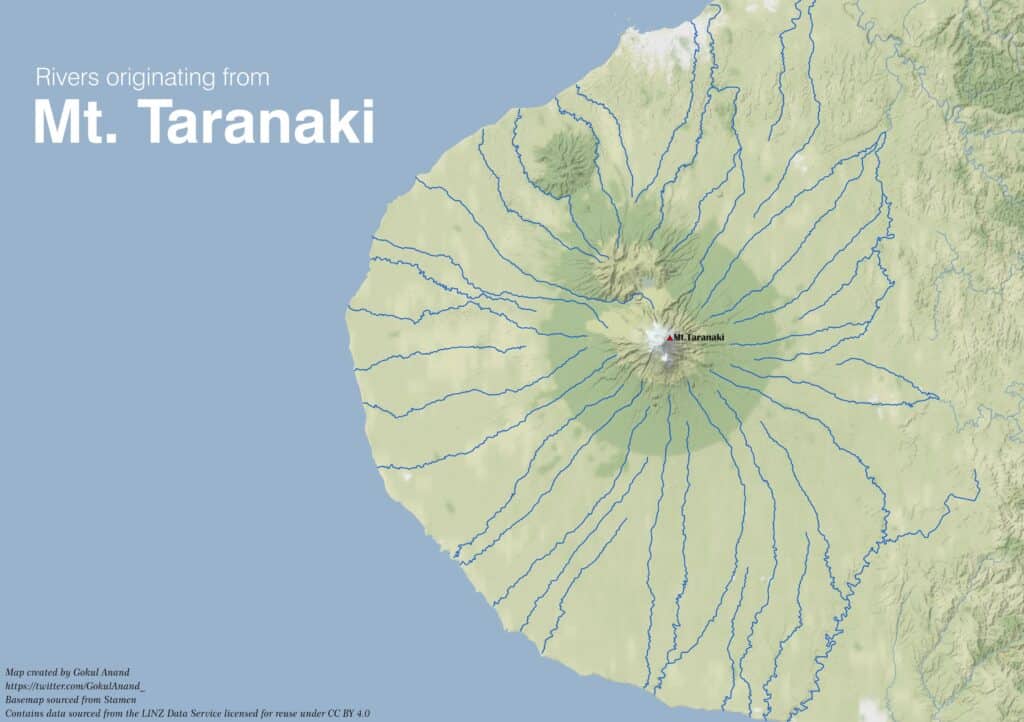
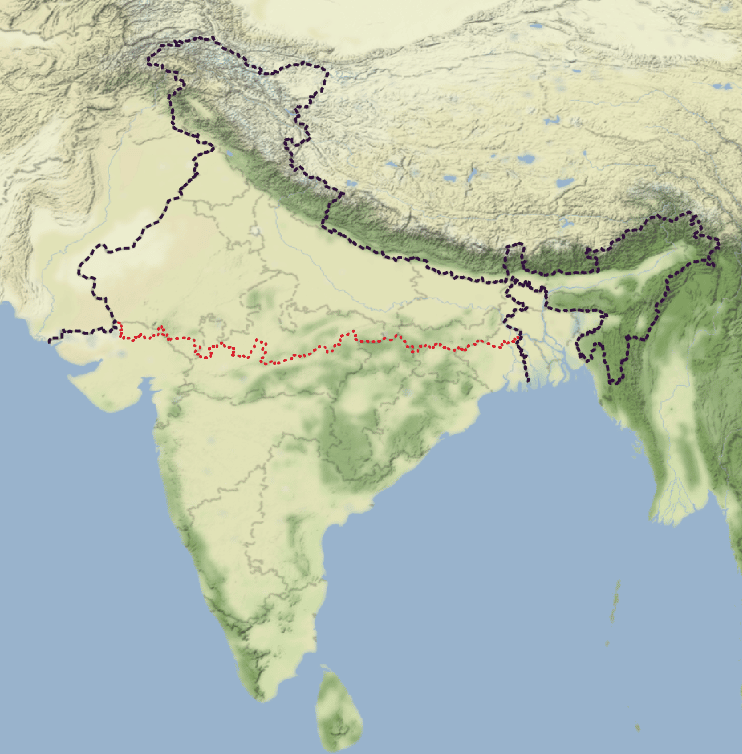
On the second day, there were two maps using Stamen Terrain, one by Gokul Anand mapping rivers around Mt. Taranaki, and another by Devdatta Tengshe dividing India into two areas of equal population:
Day 4: Green
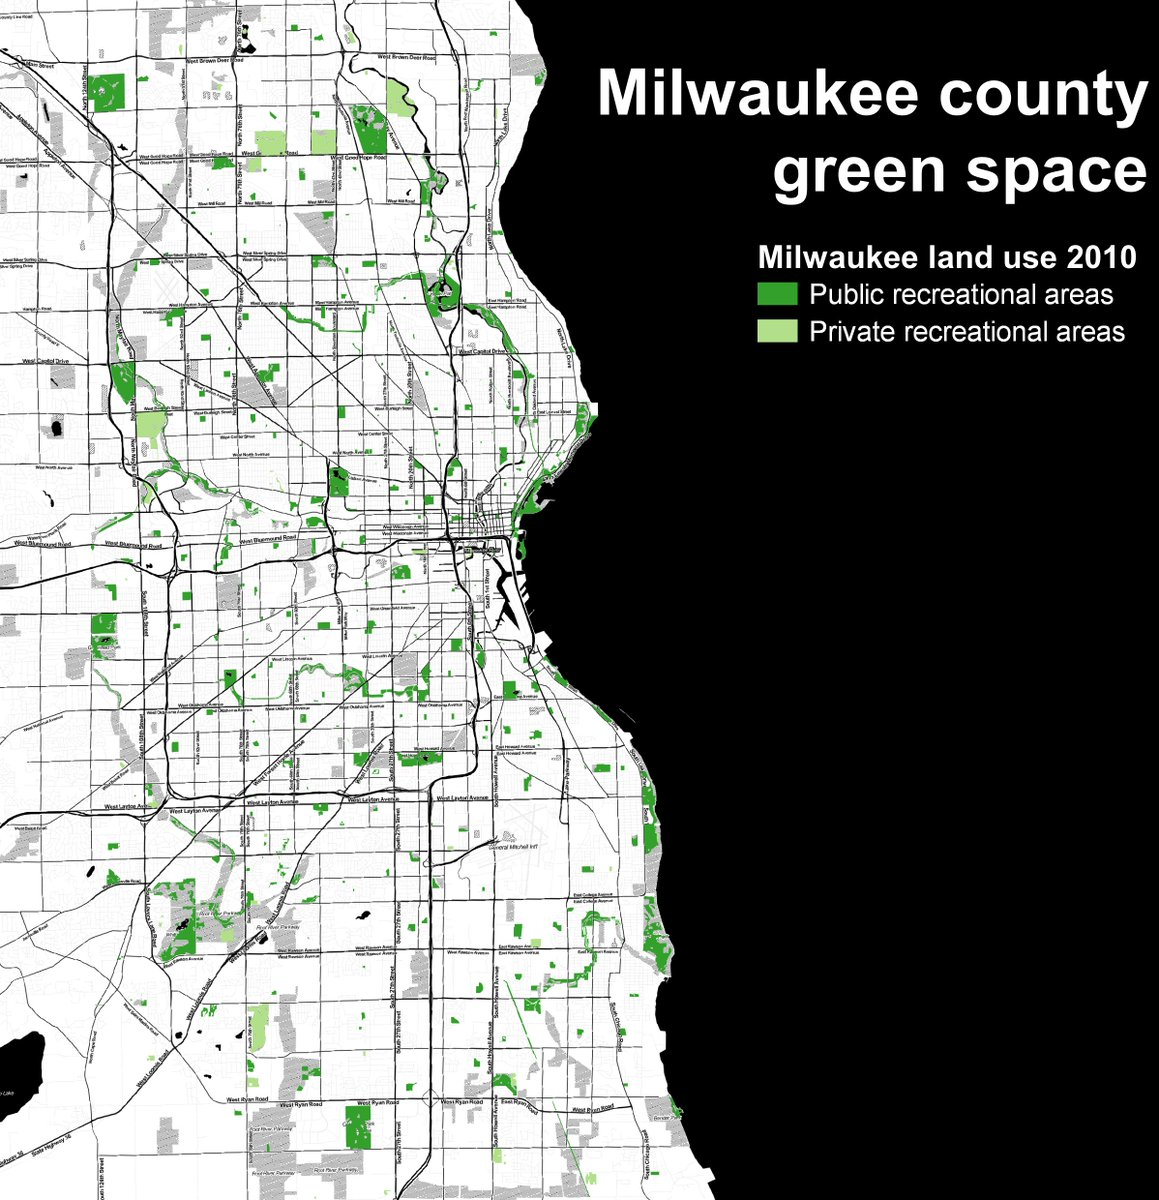
For the “Green” theme on day 4, Claire Halloran mapped greenspaces in Milwaukee County on a Stamen Toner map:
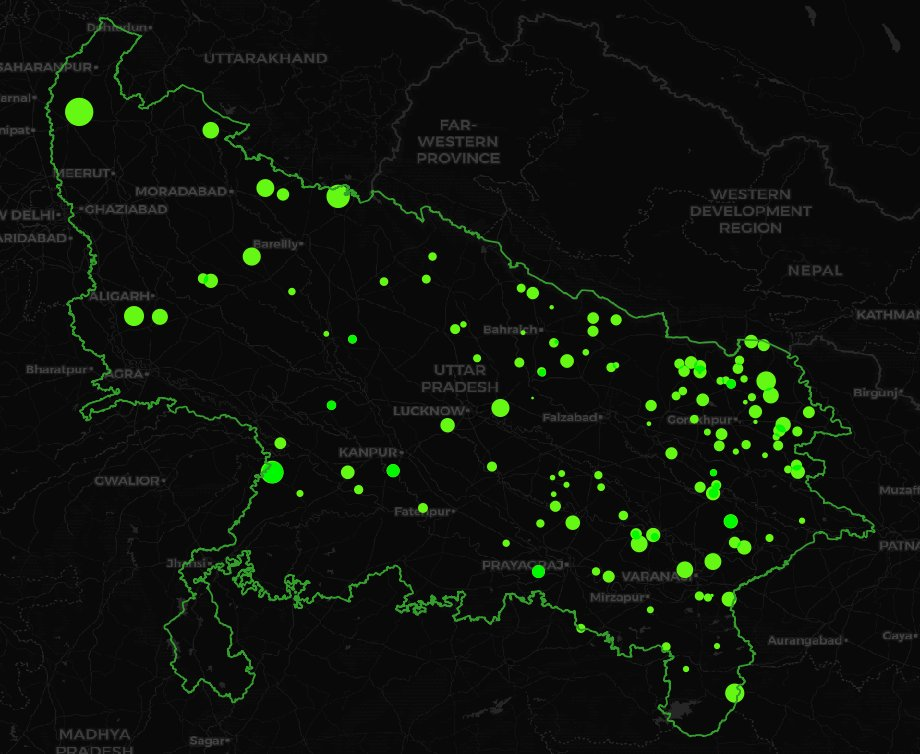
Devdatta Tengshe made a green proportional symbol map of cities named “Hara” using the Dark Matter map style that Stamen designed for CARTO:
And Heather Chamberlain’s lovely map of Kew Gardens combines a subtle Stamen Watercolor background with an overlay of a historic Ordnance Survey map:

Day 5: Ukraine
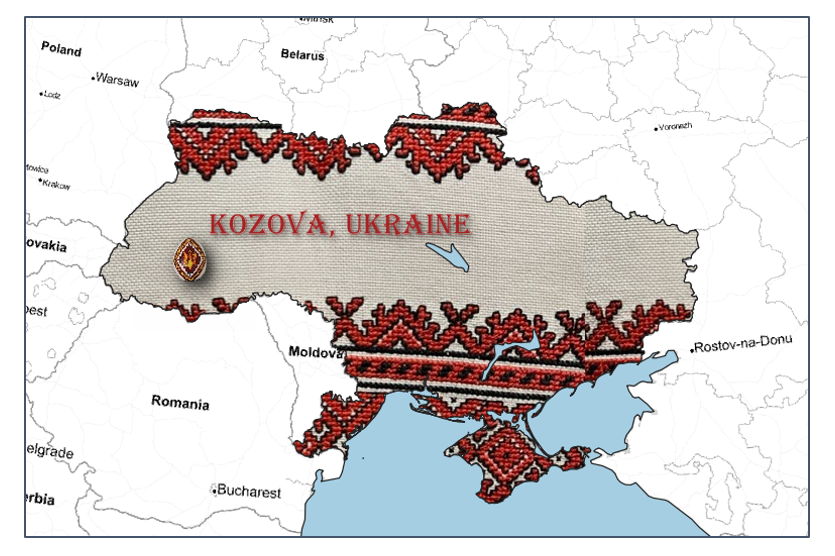
For Day 5, Diane Fritz used photography to fill in the borders of Ukraine on a Toner basemap (which was also reprojected into a non-Mercator projection using QGIS)
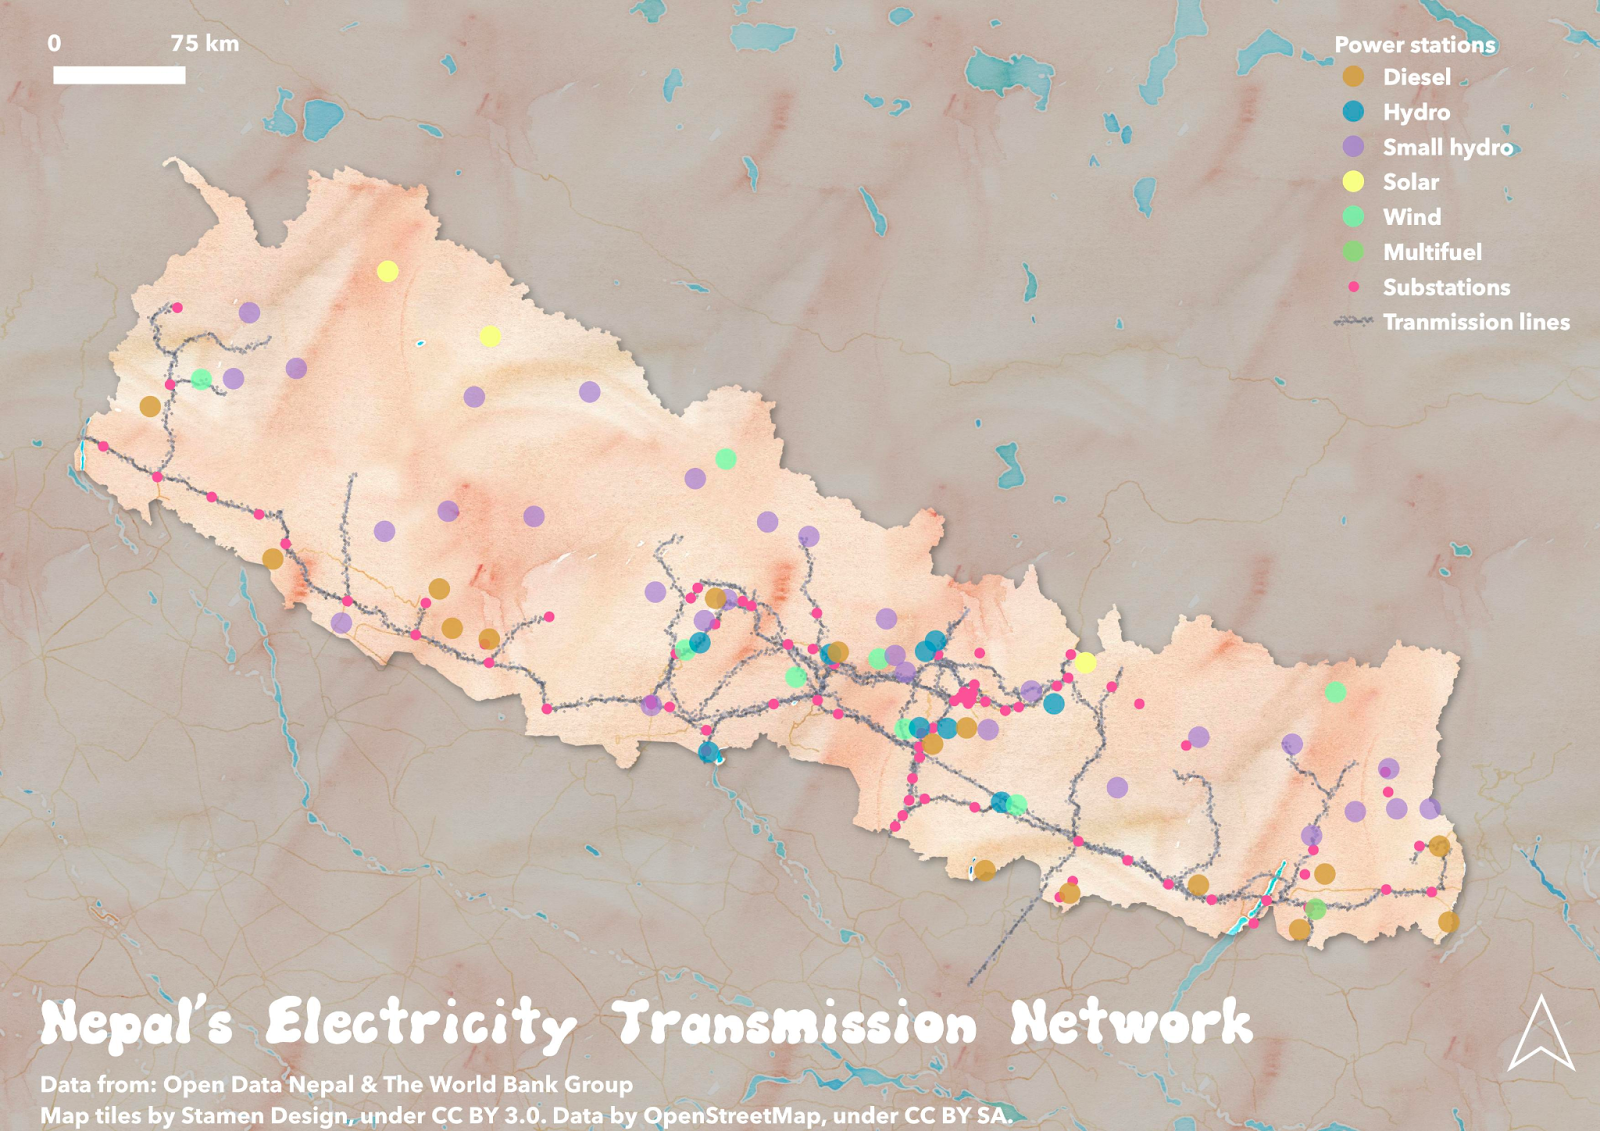
Day 6: Networks
For the “Networks” challenge, Alicia Oberholzer mapped Nepal’s electricity transmission network on a Stamen Watercolor map:
Day 7: Raster
Stamen’s basemap tiles are all raster images, making them an obvious choice for the “Raster” themed day 7. In this example, Malcolm Meyer doesn’t change the map itself, but demonstrates how to serve tiles yourself using tilemaker.org. Particularly interesting with this example is that these are not technically Stamen’s Toner tiles, but rather the vector-tile port of the Toner aesthetic created by our friends at OpenMapTiles and MapTiler.

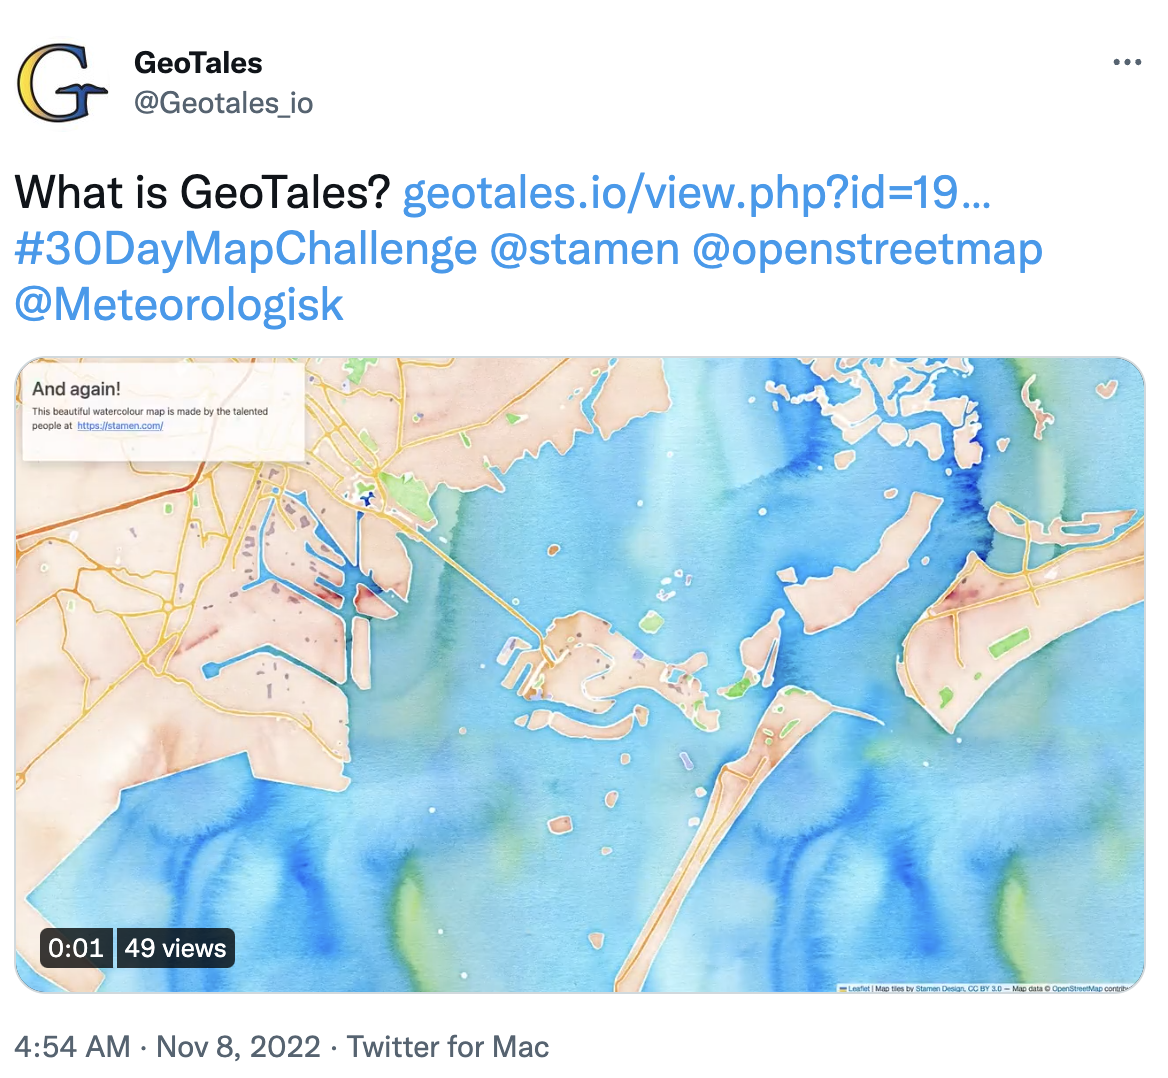
Day 8: OpenStreetMap Data
Since Stamen’s basemaps use OpenStreetMap data, of course our tiles were a good choice for Day 8, too. GeoTales created an animation that zooms in on Venice, transitioning from the default OSM tiles into the Stamen Watercolor style: (click through to see the full animation)
Devdatta Tengshe extracted just road names in New Delhi from OpenStreetMap and overlaid them on the Stamen Terrain Background style:

Claire Halloran used OpenStreetMap to extract the location of all 96 pubs in Oxford and placed them on Stamen Toner:

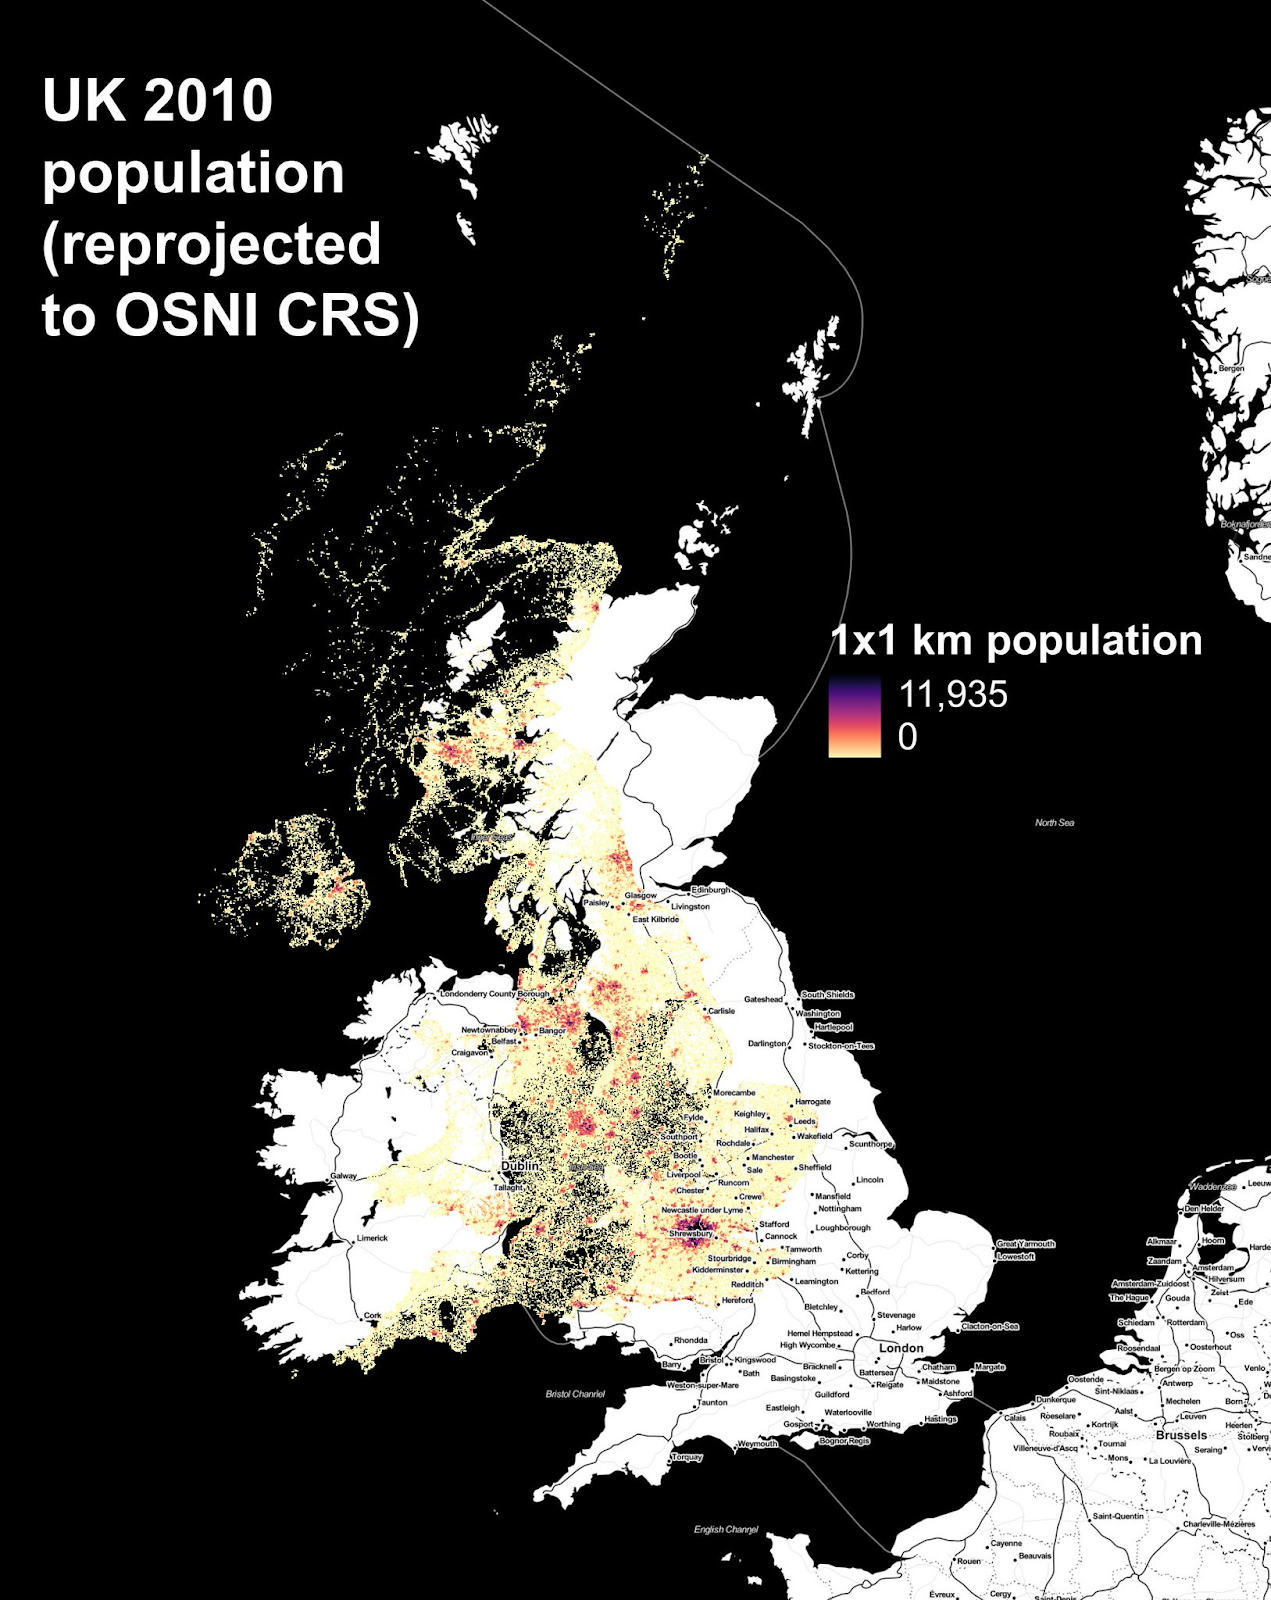
Day 10: A bad map
Day 10 was all about making bad maps or sharing carto-failures. Claire Halloran made this map of UK population deliberately misaligned from the Toner basemap by using the wrong map projection. We still think it looks pretty cool:
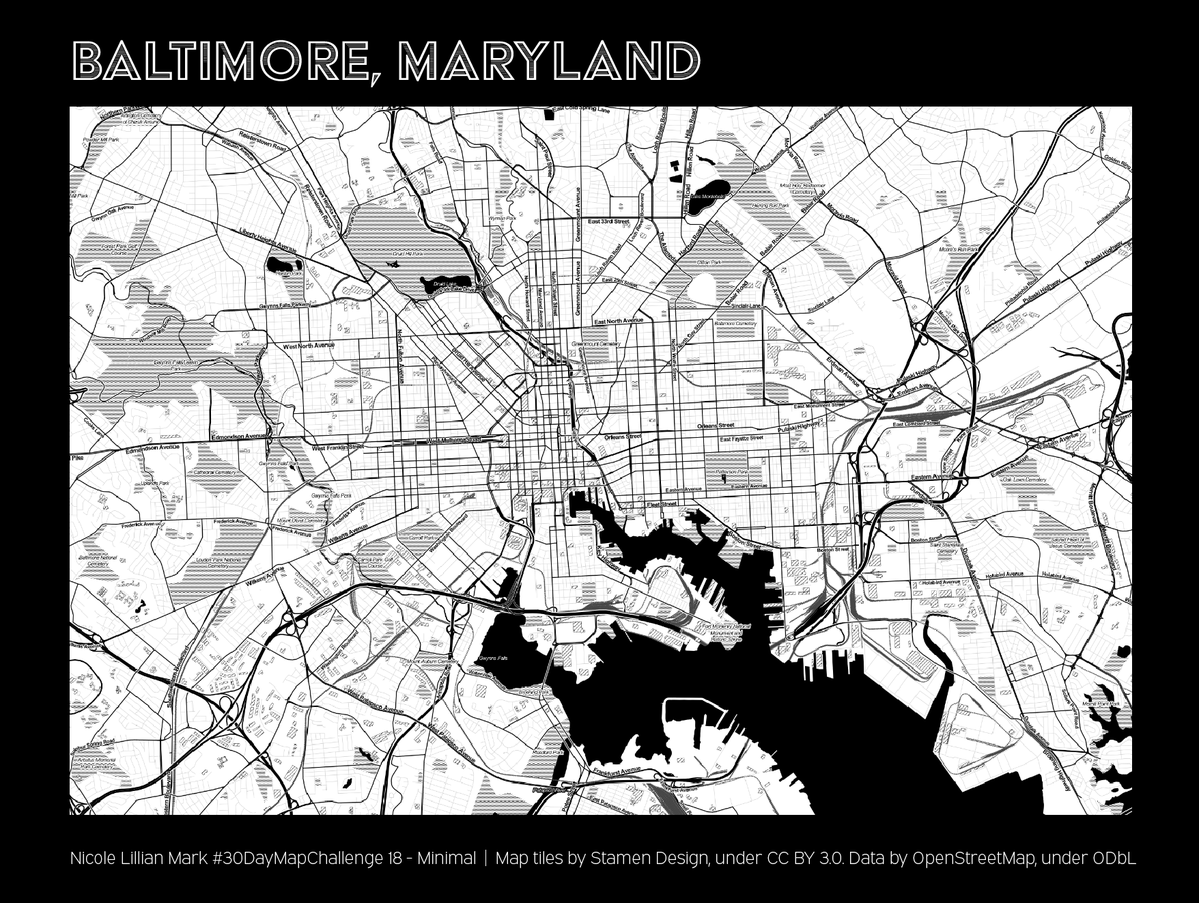
Day 16: Minimal
What map is more “minimal” than the OG minimal map, Toner? For Day 16, Nicole Lillian Mark kept it simple with the clean map of Baltimore made by loading Stamen Toner tiles into Adobe Illustrator:
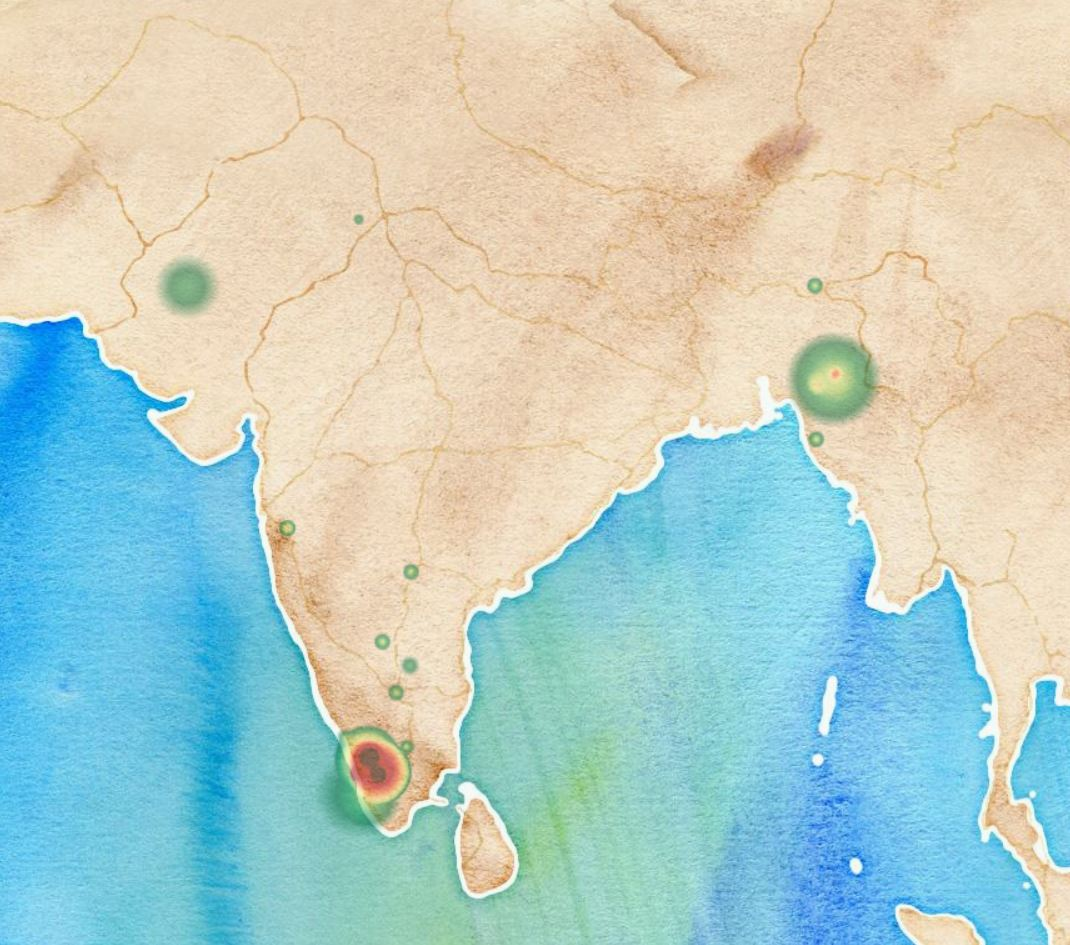
Day 20: “My favourite…”
The theme for Day 20 was mapping your favorite things. For Ark Arjun, contributing to OpenStreetMap is a favorite activity, as shown by this heatmap of OSM edits on top of a Watercolor map:
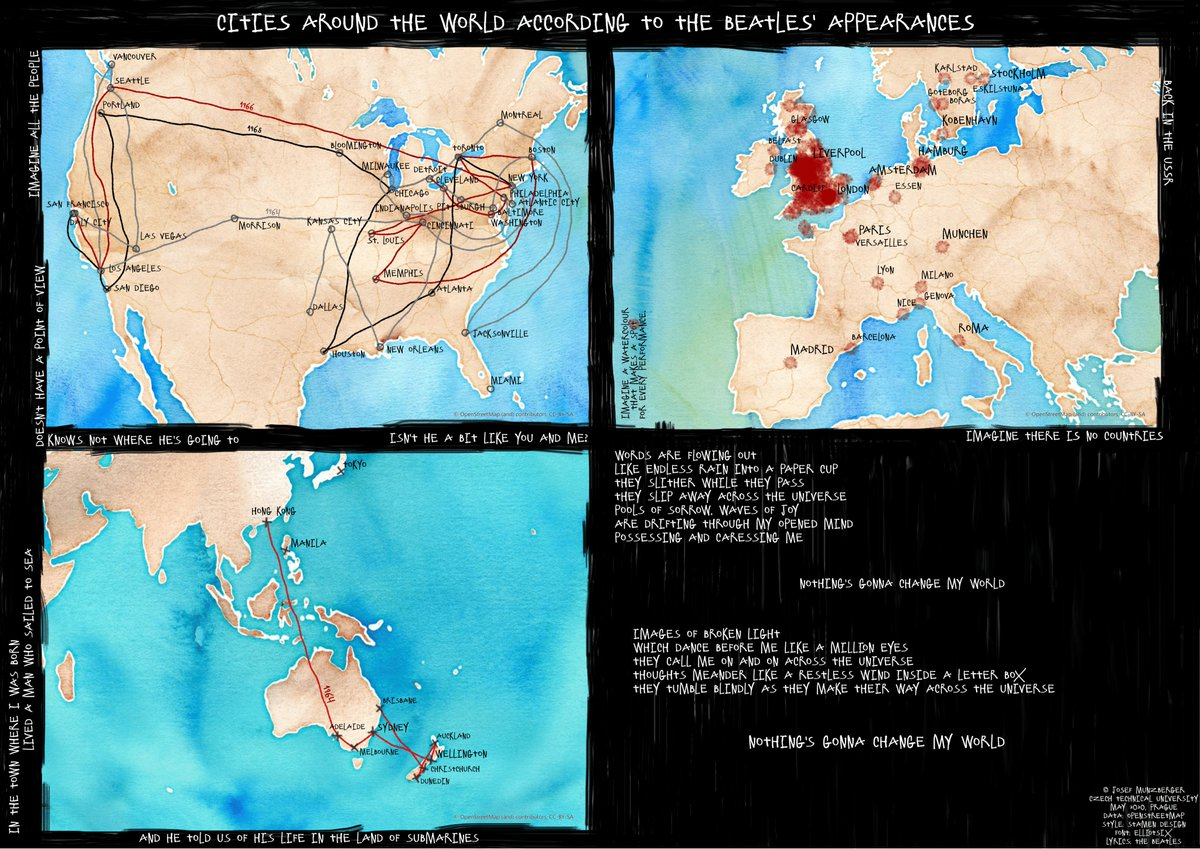
Day 27: Music
For the “Music” themed day, Josef Műnzberger of CTU Geomatics made a series of maps in ArcGIS Pro using the Watercolor basemap, showing all the cities in the world where The Beatles performed:
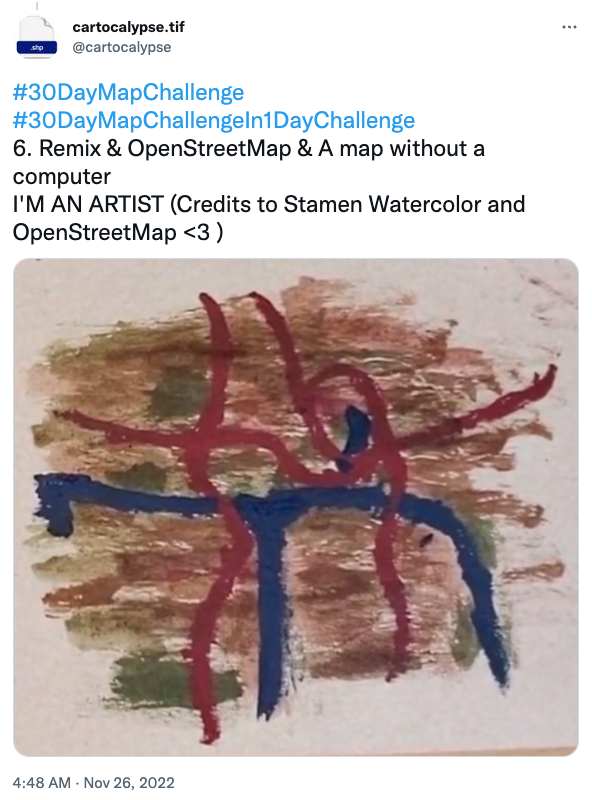
Day 30: Remix
On Day 30, the final day of the challenge, the theme was “Remix” and perhaps the cartographers were getting a bit punchy, because here is the contribution by user “cartocalypse” which appears to be a hand-drawn map homage to the Watercolor style.
What a fascinating collection of maps! There were also a ton of great examples from previous years, too. A few of our favorites from 2021 were Steven Kay’s animated Watercolor map of the Circuit de Monaco, Keith Jenkins’s CSS-framed map tiles, and GEOLayers’s animated fly-through on a Toner map. Let us know if we missed any other good uses of Stamen tiles in the wild!
Congratulations to all the map makers who made it through the #30DayMapChallenge to the end of the month, what an achievement of cartographic fortitude! Next year we’re thinking that maybe the Stamen cartography crew will do a team effort of some kind, stay tuned for that. We’re looking forward to seeing all of your maps next November!