
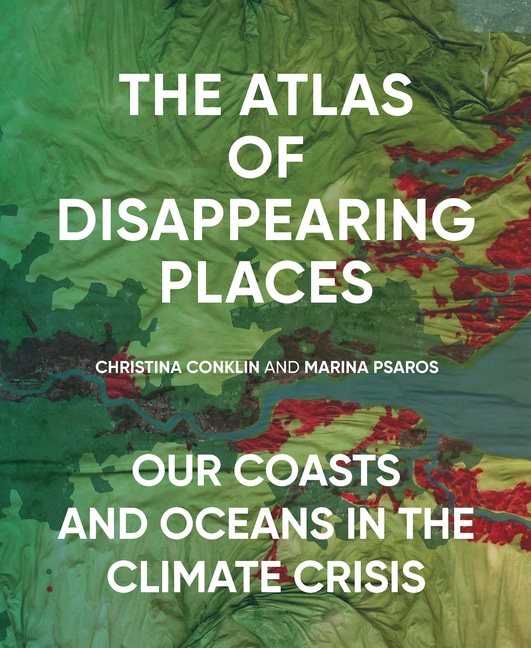
Time. Space. Salt. No, these aren’t a new take on necessary elements for cooking a delicious meal. They are some of the core themes that artist and author Christina Conklin explores in her work. Whether it’s patiently waiting for saltwater to evaporate and form intricate patterns on a concrete floor or painting maps of climate change data on dried sea lettuce, she is inspired by the ocean and all the elements and organisms within it. In this episode, Christina discusses her book The Atlas of Disappearing Places and the beautifully painted maps that accompany insightful and thoroughly-researched stories that elucidate the intimate connectivity between humans, the ocean, and the planet we all call home.
Christina grew up in Portland where she spent a lot of time traveling to the Oregon coast. It was there she discovered an obsession for the ocean and the natural world. After achieving a degree in religious studies out east, she moved back to the west coast to work as a textile artist for 20 years. Christina, who was in her 40s with two young children at the time, decided to go back to art school to pursue a master’s degree and started to experiment with salt and other unusual materials in her artwork, exploring themes around “decay, change, deep time, and the nature of things.” When the opportunity arose to do educational outreach work around sea level rise, Christina put her passion into practice by leading guided walks and public awareness events. Through this work, she connected with Marina Psaros who would soon become her co-author when they were approached to write a book that was published in September of 2021 as The Atlas of Disappearing Places.
The book uses the metaphor of the ocean as a living body, with a complex network of interconnected systems that can affect each other when one of them gets sick. And humans are a part of this system, not separate from nature at all, but instead full integrated into it. For instance, the atlas details a real situation that shows how powerful these connections are in the fourth chapter about the Cook Islands in the South Pacific. Warming ocean waters can bleach and kill coral around island nations. When these reefs die, they provide a feast for certain types of algae and, in turn, the organisms (like phytoplankton) that feed on that algae. Gambierdiscus is a genus of phytoplankton that thrives in these circumstances and produces poisons that cause disease in humans. These types of poisonings have reached epidemic levels worldwide as oceans continue to rise in temperature, not only destroying crucial marine ecosystems, but culturally, economically, and physically harming human lives.
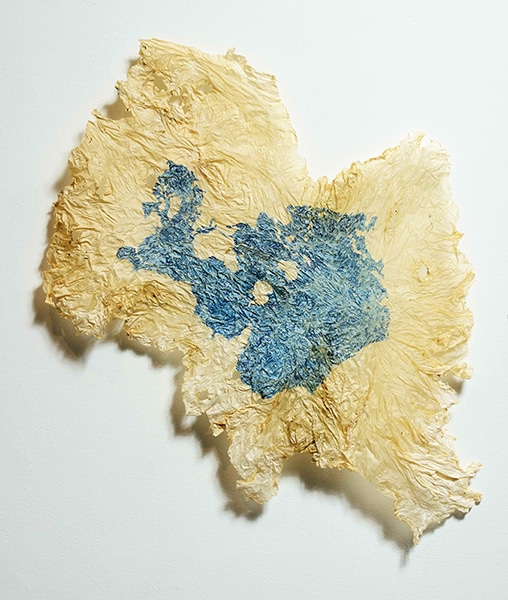
But it’s not all fire and brimstone. Part of the mission of the atlas is to provide educational stories and understanding that inspire hope and action to write new narratives of our future. The book includes speculative views from the year 2050, and while some depict a harsh reflection of the reality we might face, others hold a hopeful optimism. Accompanying each chapter and story from the future are gorgeous maps painted by Christina herself (it is an atlas after all)! The maps were all painted on dried sea lettuce with water-soluble inks, which actually reactivate the lettuce in the process. If they were to get wet again, the maps would dissolve away, hinting at a connection between space, time, and our natural world.
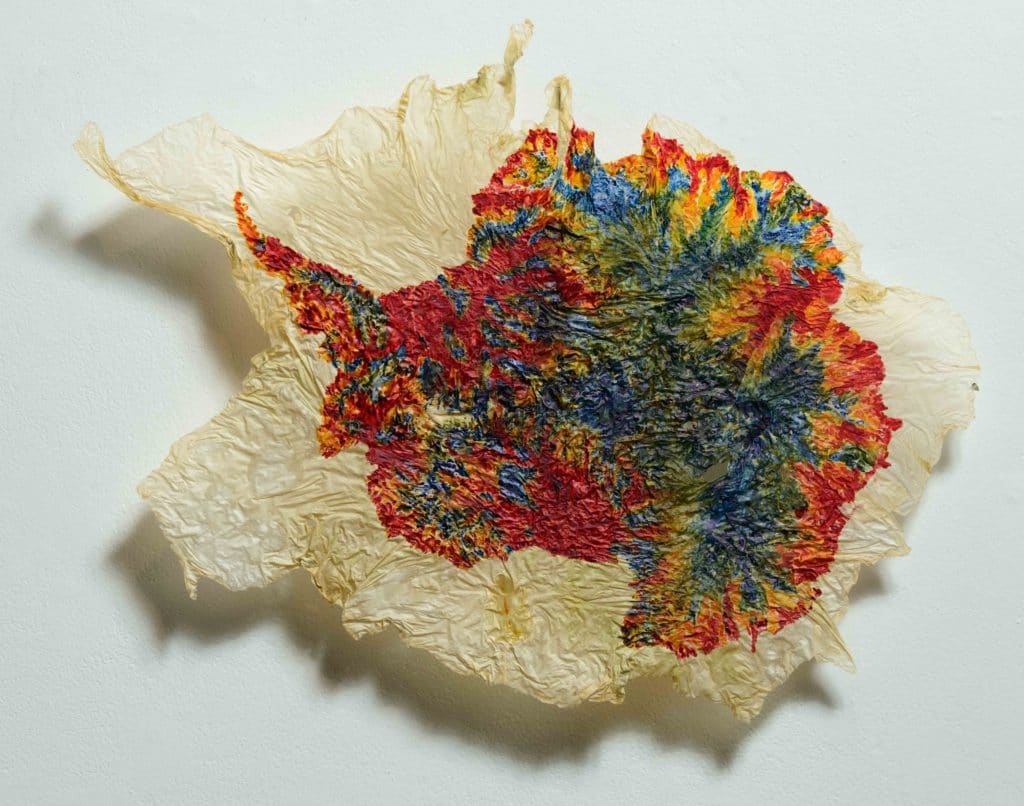
Christina implemented some brilliant uses of conventions of design and cartography in the maps. Many of the maps in the atlas make use of negative space, where images and shapes take form outside of the objects and scenes that are actually painted. In the map below, only the water is painted with colors relating to temperature anomalies, but the shapes of the landmasses we’re familiar with pop out and allow us to get some footing and make sense of the data.
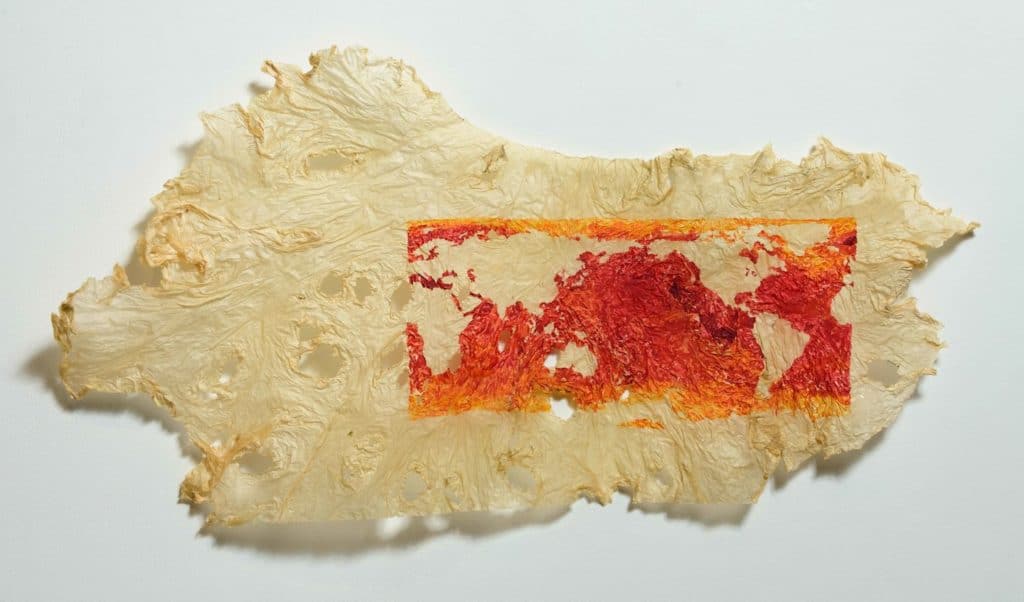
Reddish hues were also in Christina’s cartographic toolbox to imply danger in many of the maps, a theme she picked up on in the process since many of which were based off maps published by climate scientists. Many of the maps in the atlas are actually based on some work Stamen did for Climate Central with the Surging Seas Risk Zone map!
Grab a copy of The Atlas of Disappearing Places and see several more incredible maps and stories around climate change and see just how connected we are to the ocean that surrounds us (just in time for Earth Day)! Did you resonate with a particular map or story? Have thoughts on climate change mapping? Let us know on Twitter! And if you enjoyed today’s episode, please help us share it to anyone who might be interested!
Transcript — +
[music]
You’re listening to PLN8, a podcast on data, design, and the people that bring them to life, brought to you by Stamen Design.
Ross Thorn (RT): The ocean as a living body, imagining life in the year 2050, and painting maps of climate change on sheets of dry kelp. These are just a few things that come up in today’s episode. I’m Ross Thorn, a cartographer at Stamen and today’s host. I sat down with the cartographer and co-author of The Atlas of Disappearing Places, a book of maps and facts to inspire awe and action around climate change. Please welcome my guest.
Christina Conklin (CC): Christina Conklin. I’m an artist and a writer.
RT: Thank you so much for coming on the podcast. We’ve talked about this, but I found your book in my local public library and just took it home and was blown away. So I immediately wanted to reach out and have you on here. So I really appreciate you taking the time to do this.
CC: Well, thanks so much. Like I said, I’m thrilled that my book on the oceans got into a Midwestern public library. Very exciting.
RT: Yes. On the saltless sea of superior. [laughter] So could you just start, maybe tell me a little bit about yourself and about your upbringing and any education and career work that sticks out to you and how you sort of got to become an artist and a writer?
CC: Right. Oh, gosh. Let’s see. Well, I grew up in Portland, Oregon, and spent a lot of time going to the Oregon Coast. So the ocean has always been kind of my place. I think people have places. It’s either they’re city people or mountain people or desert people. So I’m an “ocean people” and loved the Pacific Northwest. I’ve always been a West Coast girl and went back east to college and spent some time in Europe but returned to the West Coast. And I’ve always had craft and artistic leanings. I learned to weave at my fairly hippie retro high school, which was awesome. And basically, I’ve been involved in textiles ever since. And I was a textile artist for about 20 years, both avocationally and vocationally, and then went back to art school to get a master’s degree in my 40s with young children. That is a challenging thing to do, but. Yeah. So I did that, and that really opened my mind and my eyes a lot. So I got less involved in textiles but more involved in unusual materials like salt and seaweed and corrosive, erosive processes to sort of explore what’s going on, what’s happening in our world. [laughter]
And so my work there looked a lot at kind of decay and change and deep time, the nature of things. And so when I got the opportunity after graduate school to work on some sea level rise education work for San Mateo County, I was leading guided walks for the public and doing some public awareness events as part of the county’s sort of education information outreach work. And I connected with the woman who ended up being my coauthor on the book. And yeah. The opportunity to write the book, The Atlas of Disappearing Places, dropped in our laps, and we jumped on it. And here we are four years later, having just completed and published it a few months ago.
RT: Yeah. That’s incredible. One thing I was definitely really drawn to, and you mentioned it too, is salt. I’ve looked at a number of portfolios online, especially while I’m trying to develop my own, and I saw things like maps and projects and then salting. And I’ve never, ever seen that as a portfolio heading. [laughter] So I’d love to know more about that and how you started to use salt and what really inspired you to start creating that with your projects.
CC: Well, I think it has to do with this concept of deep time and the ocean as this, for me, this kind of infinite cyclical process-based container that– so I guess, essentially, it’s about evaporation. And so I would make these salt maps by pouring heavily concentrated salt water onto cement floors. And then the water evaporates, and you’re left with a salt map. And I would build layers and layers and layers over days. And so that process of evoking a map in the ocean by using saltwater just was really kind of contemplative but also – I don’t know – to me, spoke of some sort of scientific process as well. You’re sort of observing and not interrupting what’s actually happening.
So yes. I got involved in salt, with salt a lot and started– another project with salt is writing words in the landscape because– so salting as a verb is used– I had not realized this until I did this research, but it’s both a poisoning process. So you can poison an enemy’s land with salt. That’s called salting the land. It’s also used as a blessing and as sort of a good-luck gesture. And so to me– I don’t know. And salt has been so important to people and to culture over forever. It’s a fascinating material in that way. It’s elemental. It’s essential. And it’s also poisonous, right? If we have too much salt, we get sick. It, to me, speaks of this borderline between health and illness that works well when speaking about ecological issues as well.
RT: That’s so wild that you brought that up too because I was just thinking about this the other day, separate from looking into your work too, that there’s the phrase of like, “Oh, salt of the earth,” which is a good thing. Or I thought it was when I first read that phrase. And then you’d read a historical thing like, “Yeah. They burned this village to the ground and salted the earth.” I was like, “Wait, isn’t salt of the earth a good thing?” [laughter]
CC: Well, that actually comes– it comes around. So I was a religious studies major in college. And so salt of the earth is actually a biblical phrase. Right. And so it has all these many, many connotations, and that’s kind of why I love it. And yeah. We can just continue to work with it. Its connection to the ocean goes back to kind of the core of what I’m interested in.
RT: Another thing that blows my mind about salt is that– especially table salt, if we take it. There’s numbers of different salts as you know. And I studied a little bit of geology in my chemistry. I was like, “Oh, yeah. Salt is not just sodium and chloride. There’s different types of salt.” And it’s like a combination of some of these elements that are often poisonous or terribly destructive on their own. And then when you combine them, it becomes this thing that we use in so many different ways and this thing that represents everything you just mentioned too.
CC: Yeah. And there used to be, again, these inland seas. The reason you can have Himalayan table salt is because the Himalayas used to be the bottom of the ocean. So it puts us in a context of time that I think is really important to keep at the forefront, right? We get so wrapped up in this quarter, this day, this month, this year, and stepping back and really kind of having that bigger view is really important to me personally.
RT: And speaking of salt as time and salt and space too, a lot of your projects that I sort of looked through, you had the bricks of salt that you had people take and make postcards and send them to you. And the salt writings you mentioned. I’m drawn to these geographic undertones, which is probably just me looking for that as a geographer and a cartographer myself. And you mentioned making some of these maps with the salt and the dissolution. How did you start making maps, and how did your relationship with maps sort of develop over time?
CC: I really feel like all of my work, at least for the past 15 years, has been mapping in one form or another. And it’s either mapping space or time or the imagination maybe sometimes. My maps are– for the book, they’re literal, but mostly, they’re much more imaginary, I guess. And that’s kind of what I love about them. I’ve made maps with Sumi ink that just sort of trace the memory of the fabric that it’s mapping. It does its own thing. I’ve done lots of– I mean, I think of it as sort of psychogeography, which is a fancy word for just making mind maps and letting the maps make themselves. And really for me, one of the most important elements of this is to sort of do as little as possible. This idea of the artist as author and authority or something like that, I really want natural elements to reveal themselves and to maybe instigate or start a conversation with an element but really then step out of the way because, to me, humans are just too noisy. [laughter] We take up a lot of space. And there’s a lot of– just the revelation that is nature is, if you slow down and shut up, endlessly mesmerizing. So that’s where really I try to find myself or create work, is at this kind of quieter space where I’m hopefully just helping some other material or element speak.
RT: I love that. As I mentioned before we started recording here, that I’m a musician too, and sometimes I enjoy writing songs. But it’s not like I’m inventing new notes or inventing anything new. And one of my favorite analogies is from– I’m pretty sure it’s from this children’s movie about penguins surfing. [laughter] But one of these penguins has to carve their own surfboard. And his mentor or something is like, “The surfboard is already in there. You just have to carve it out.” And for some reason, that has stuck with me.
CC: Yeah. You just got to tune in, tune into the cosmic vibe. [laughter]
RT: Exactly. Yes. Exactly. Oh my gosh.
CC: Yeah. It’s more about listening than talking is, I guess, what I would like to– the space I want to inhabit.
RT: I’d love to segue into the book itself, The Atlas of Disappearing Places. Could you give me a little summary of the book, a little introduction for the book and what it’s all about and its purpose, I guess?
CC: Sure. Well, it’s 20 different stories of different places around the world, sort of case studies, little portraits of particular places as they’re being impacted by a specific climate crisis impact in the ocean. So some of the places are along shores and in cities because that’s where we interface with the ocean the most. But then it was really important to me that we also write about the places we can’t see, right? The deep ocean, the middle of the ocean, the microscopic food web. I mean, these actually were the most interesting parts for me because I wrote the book to really understand what this thing is that I am drawn to so strongly and what’s going on out there, and how is the climate crisis impacting the ocean? I think when we were approached by The New Press to write the book, there was one book on sea level rise out in the public sphere. And now there are more, but there still are no other books that look at the ocean as a whole, the ocean as a being, right? So there’s an infinite amount of complexity in life in the ocean, and our entire planet depends on it. We should really know a little more about what’s going on out there. And it was surprising to The New Press, I think, and to me that so little attention is paid. And so I wanted to attend and learn for myself and share the stories with other people.
So 20 stories, four sections. Let me think in the right order. Changing chemistry, so that we’re changing the very chemical nature of the ocean through acidification and warming and pollution. And then strengthening storms. Of course, we’ve seen these in the news. They’re more frequent and more intense. Warming waters. The entire ocean is warmer and warming fast. It’s happening most dramatically at the poles, which is, of course, the most dangerous place for it to happen. But of course, it’s just a natural system. That’s the way it’s going to happen. And then rising seas. So yeah. Sea level rise, again, happening everywhere all at once starting in about– I mean, started now, of course, but the latest NOAA report is that it’ll have risen a foot or a foot and a half on the East Coast by 2050. And that’s a catastrophic amount actually. We’re not prepared. [laughter] So I wanted to write a book that would be very relatable because these stories are very specific. But then they each also extrapolate to a thousand other places around the world. And we tried to talk a little bit about some of those places and include some bar graphs and global maps to show the extent of each of these problems as well.
RT: Yeah. And that none of these exist in a vacuum. That’s something I had learned too that– and you mentioned this. The whole Earth and the whole ocean is a system, and it’s all connected, and things like coral dying increases this particular type of algae that feeds on them, which can be toxic. And it went beyond some of the traditional things that we think about. And you mentioned that there’s sea level rise, and there’s ice caps melting that we’ve sort of seen for the past 20-plus years as the poster child of climate change. But it’s so much more. And it’s this interconnectedness that really hammers it home and, I think, is kind of, like you said, unsung in this conversation.
CC: Well, yeah. I just wanted to say about that because that was really my core reason, in addition to my respect for the ocean. But I really feel like what’s needed culturally right now is a sort of big paradigm shift, this big worldview shift to understanding at a really deep level this interconnection and that we are nature, right? We are not separate and above and different than nature. We are utterly dependent upon nature, the natural system. We are it. And so to really deeply consider this more integrated worldview, to me, is the only way we chart a different course out of this mess because we have really torn the fabric of the natural world that we depend on. And yeah. It’s old hat to say it’s up to us to change our ways. But if it comes from this sort of deep philosophical, even spiritual place of understanding how connected each is to all, then that’s, to me, where real change can be possible.
RT: Yeah. I, a lot of times, think of things through sort of a playful lens and a lot of video games, or I should say just a lot of games in maps. And when it’s tied to geography, it kind of puts on this sort of colonial– and you have to conquer land. You have to extract these resources which help you win the game, which is definitely something that we’re perpetuating in such an entertainment space that we don’t think about that. This is a fantasy world, but it’s still those things that we’re hammering home, which is problematic.
CC: It would be so great if there were some games that actually had regenerative systemic worldviews. [laughter] There probably are. But yeah. I guess what I came to learn through this book, the research, is that there is this amazing community of people out in the world working on regenerative work in whatever their field is, whether it’s design or agriculture or mariculture, which is cultivating seaweed to reforest the ocean and soak up all the carbon. There are fascinating things happening all over. And each of these 20 chapters also has a story from the year 2050 that sort of projects what could happen in that particular place given the facts on the ground. And we tried to make them hopeful. But of course, there are some real challenges ahead for all of us, so. But to me, it was very inspiring to see how many people are working so hard to write this new– call it post-colonial, post-capitalist. Like where are we going to go, and what are we going to do? And there is no way, right? People ask me, “Where can I move?” I’m like, “We got one planet. Let’s just dig in and let’s do the work.” Yeah.
RT: You mentioned the views from 2050, and I really enjoyed reading those. They’re sort of, like you said, imaginary and speculative. And some things were good, and some things were bad. And it’s a fun– I guess I shouldn’t say necessarily a fun, but it was a good thought exercise in imagining where we could be. And you also included some graphics of where things are projected to be in 2050. And when we talk about or make maps of futures that could be, you kind of can take a couple of different approaches, especially given how grim some futures can be, but when we’re realistic about it. I’ve seen some maps that sort of add a little playful element or something, showing a sea level rise in a coastal city and naming a set of Islands after the neighborhood that’s there. And sometimes it’s a little tongue-in-cheek, but it’s also helping us to pay attention.
CC: Well, that sounds fun. I mean, I should look up more of that. Send me some links. I want to know.
RT: I will.
CC: Because, yeah, it’s hard to take all this on board. And it can be such an overwhelming and serious topic, and people shut down real easily. Yeah. We tried to, like I said, make these stories not too grim, but it was hard to avoid it sometimes. It really was. Because history is happening now, it’s been interesting to look at a couple of real-life examples. Like in the chapter I wrote about the Cook Islands, where deep sea mining is a real threat to the local ecology and the sacred waters that they protected with a marine protected area, I predicted that in 2022, the new prime minister would open the sea up for scraping the bottom of its manganese deposits. But actually, he did it in 2021, so. [laughter] So I was even correct with the change of power that happened there, but.
RT: But on the other side of things, I’ve been– not encouraged, but, of course, what’s going on in Myanmar right now with the uprising against the junta is interesting to me because I’ve been reading how the people of Myanmar have become more sympathetic to the Rohingya Muslim refugees that I wrote about in the chapter on Myanmar. There’s a new solidarity happening there against dictatorship that I had not predicted because there’s been this deeply embedded ethnic tension and hatred going back for hundreds of years. So anyway. I’m enjoying watching history prove me right and wrong. [laughter]
CC: Yes. I was just going to say it’s got to be really refreshing to be like, “Oh, man, I was wrong about a little bit of cynicism, which I’m happy about.”
S2 00:22:43.658 Yeah. It’s fantastic! I mean, bring it on. Yeah.
RT: Please prove me very wrong!
CC: Prove me wrong. Yeah.
RT: That’s awesome. One of the things that we talk about here at Stamen a lot as a data vis and cartography studio is that we love maps. We have a lot of people who are map makers. And as I mentioned earlier, the maps in here just struck me as this wonderful– and they’re beautiful aesthetically, even though, like we mentioned, the stories themselves aren’t necessarily. And it’s sort of a warning, but these maps are so evocative in things that you include in them. Can you tell me a little bit about the maps and how you chose the method to create them that you did?
CC: Right. Well, I tried a bunch of different things, but it did make sense eventually to– I had already been working with algae a little bit. And so I began harvesting larger and larger pieces of algae from the shore nearby here in California. And I would gather these large– they call it sea lettuce. It’s the genus Ulva. It’s sort of paper-thin, looks like lettuce. So bring it back to my studio and kind of lay it out and stretch it and dry it and get these beautiful glassy sheets of parchment in a brilliant green. And after time, actually, the chlorophyll fades away, and they become a parchment tan color. And so I began painting the climate maps that are published by climate scientists. I would find these heartbreaking maps in the journal articles that the scientists had developed showing ice loss in the Arctic and flood levels here and there and just all sorts of different dead zones in the ocean.
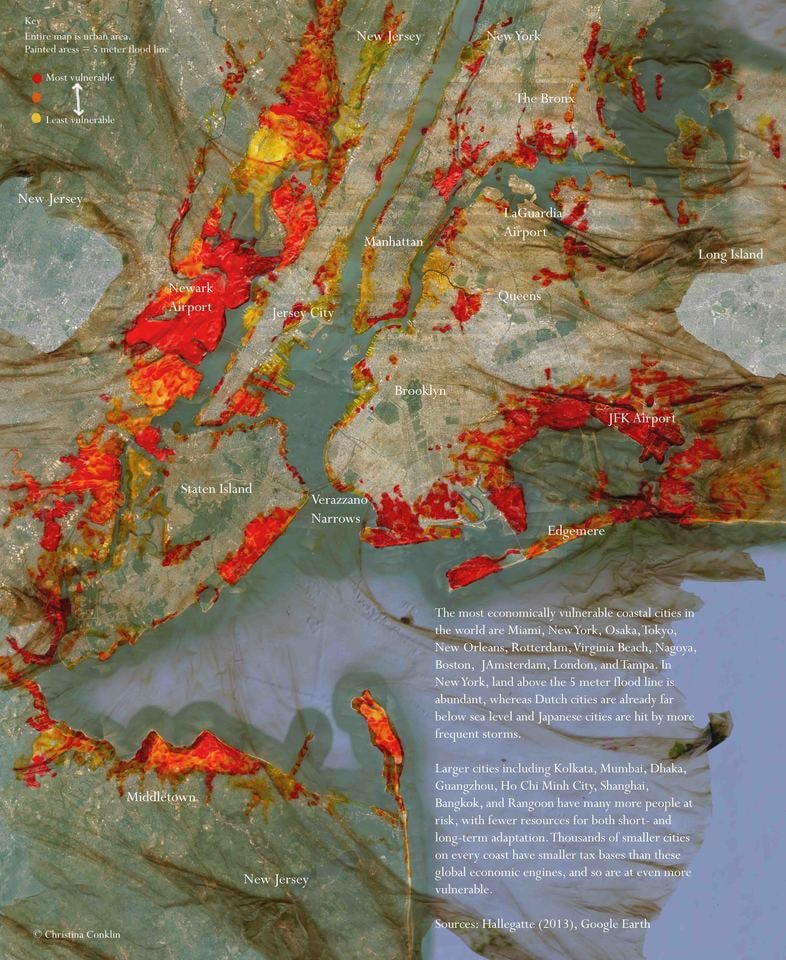
And so I just literally copied and replicated the scientific data onto the seaweed using inks. And the ink actually reanimates the seaweed. So then there’s this crazy process if it’s getting wet again, and how do you control it? So it’s a fun material to work with because it literally is still alive in this sense. That is really great for me. I love it. And then just layered that, in many cases, layered it on top of a Google Earth map, a satellite map to give some geographical reference points. And some of them have that, and some of them don’t, but. Yeah. And then did some labeling just to say, what are we looking at? And each chapter is, like I said, approaching a different topic, whether it’s plastics in the ocean or refugee patterns or, yeah, the dead zones in the open ocean.
RT: I love that you first give this disclaimer about these maps and data being opinionated and subversive. And I think we try to hammer on something like that with every episode, is that maps– “All maps lie” is a term that we love to talk about and muse about. And you mentioned overlaying them with satellite imagery and annotations and things. And I was really intrigued by this mixed media approach. Some are specifically just a sea lettuce as well as some sketches of animals or life forms that you mentioned in the book. And some are sea lettuce with annotations or overlaid satellite imagery. And then there’s lots of charts and graphs too that are mostly just digitally produced. Was that something that–? Tell me a little bit about that. Is that something that’s intentional, that there’s a separation between lots of geographies are on this sea lettuce and on this medium, and some of this more raw data is less so.
CC: Right. I think that comes down to having a co-author, and we have slightly different kind of expertise and orientations. And she’s more a data graphics girl, and I’m more of an art mapping girl. And so we just brought both things to the table. And it’s all publicly available data graphics from sources like the WHO or the UN or wherever it might be. One of the sites that I used primarily for– the maps that had to do with storms and sea level rise in particular, Climate Central is a really great outfit that has developed the most sophisticated sea level rise mapping tool. And they have one; it’s called Surging Seas. And you can go onto their site and look anywhere in the world and find very accurate maps of wherever you are. And it’s just fascinating to wander around in there. [laughter]
RT: Yeah. That’s some of Stamen’s work.
CC: Is it?
RT: Take a look at that link I sent to you in chat here.
CC: That’s them.
RT: That’s the one. Okay. Well, that is really funny because, yeah–
CC: Is that really you guys?
RT: That’s really us. [laughter]
CC: Wow. Well, so basically, every– not every map, but the New York map is your map and the London map and– yeah. Pretty much at least half of the maps are using your goods.
RT: That’s incredible. [laughter] What an amazing full circle sort of thing we’ve got here. Yeah. We talk about this on our website. And like I had mentioned too, this is before I came here. But there’s definitely more about the development of that map on our site too.
CC: Oh, that’s fantastic. I mean, I was certainly familiar with the watercolor maps and some of your projects, but I certainly didn’t know that you were the spine behind the– [laughter]
RT: Yeah. This is crazy. My mind is blown.
CC: That’s fantastic. Well, we were meant to be.
RT: We were talking about getting those cosmic vibes in and it just–
CC: That’s right. [laughter] That’s right.
RT: It aligned us.
CC: Planetary alignments.
RT: Oh my goodness. That’s so awesome. One thing that I also loved is that right off the start, you start with the Spillhaus projection, which is something that I love. And I think it’s a perfect choice to sort of set the tone and the conversation around the ocean, especially since the part it plays in all these systems you talk about in the book. And you’ve mentioned that these maps are sort of based on other maps, which we found out from some published things and also some Stamen work. And you sort of lean into these common practices in language for maps such as red equals danger. Tell me about some of these other places where you maybe embraced some of these known cartographic conventions that were in these maps used for reference or that you even brought in yourself that maybe translated a little bit better to working with the sea lettuce as well as maybe some that you kind of rejected or that didn’t work for how you wanted to make these maps.
CC: Well, I guess I can say I wish I were a cartographer.
RT: I want to interject right there and just say that if you’ve made a map, you are a cartographer, so. [laughter]
CC: Well, I’m so glad. I’m going to put that on my card. That’s great.
RT: Welcome to the club. Yes.
CC: Yay. I’m so excited. [laughter] Yeah. Because I don’t feel like I’m– I’m an artist, so I took all of these as visual art projects. And really, I mean, the “red equals danger” thing was something I realized after I’d made many of them. I was just, as I said, transcribing data that others had portrayed. I made very few color changes in the course of the book because I wanted to really accurately show what the climate scientists are showing us. So I thought this book was going to come out with these lovely blue, green maps. So I just thought it was going to be so pretty. And I was stunned. I was really stunned when I started going through, and I was like, “Oh, man, we’re screwed.” [laughter]
RT: This is not as good as I thought it was going to be.
CC: Oh, this is not as good as I thought it was going to be. So right. I mean, I guess I came in with a certain naivete about the maps and really just looked for the best image I could find that would visually convey something, something of use for that particular impact because each impact, the map of the Pacific Gyre trash pit is pretty different than the social vulnerability map of New York City in a flood zone, but they both have a lot of red.
RT: Yeah. I think that’s wonderful that you sort of approached it with that, I guess, what you described as a lack of cartographic awareness of how things are typically done, and you kind of noticed things after the fact. And I think that is sometimes more effective too in that cartographers who are “trained”, whatever, they’ll be like, “Oh, no. This is the way things are done.” But maybe things shift in how we perceive things as well in that “red equals bad” is a rockable thing for most people. And so coming at it with the naivete that you mentioned kind of also just makes it a little bit more accessible for other folks to read who are also not cartographic experts.
CC: Well, I think that’s the thing. Having written this book as an artist and somebody who likes to write but writing a book about the ocean, both of us were starting from scratch with our research. We’re not scientists. And so to write a science-oriented cartographically, visually driven book really coming at it as generalists. And the whole idea was to make something that’s very approachable for regular folks, right? I mean, we tried to write the smartest book we could. It gets into some terminology and some details in some places that you can really wade into it if you want to. But it also can happen at this level of story and place and considerations of just where are we in the world right now that hopefully is very approachable.
RT: Personally, I think that’s super important in narrating these climate realities that the stories have to be approachable because sometimes people like, “Oh, that’s too much for me,” or it can fall to the back-burner if it kind of hits a wall in someone’s brain. So I think that’s a wonderful way to go about it.
CC: Yeah. Thanks.
RT: One thing that really stuck out to me in a lot of these maps is your use of negative space in the maps. For those listening, if anyone’s not sure, negative space is sort of like the empty space around a subject of a piece, so most often recognized when it forms something interesting itself. So if you’ve ever seen that sort of like optical illusion of an image that’s a vase, but it’s also two silhouettes, it sort of leans on negative space. But your use of it, it lets the reader sort of piece together a lot of what they’re looking at by these recognizable shapes that appear in the margins or, I guess, outside of what you’re actually painting. So we talked about the Spill House map, or you have another map showing jellyfish population that just shows the ocean, and then you sort of see the pieces of land appear in the background. And one that really stuck out to me is this one. If anyone listening has the book, it’s on pages 82 and 83. It’s this two-page spread of the temperature anomaly where the ocean is filled with these vibrant oranges and reds. And we’ll include that in our blog post too, but the negative space is what really provides that context for all of that to gain some sort of geographic meaning in the reader’s mind. And so first, I just want to compliment you on it because it’s incredible, and it really ties into the fact of disappearing places in my mind, that these are negative– they sort of are in the background and – I don’t know – the whole– [laughter] I could probably formulate a better sentence about that, but it was just beautiful to look at.
CC: Well, I was surprised how often I could create a map by just painting the water. I mean, I guess is what you’re sort of saying.
RT: Yeah. Exactly.
CC: The land is the negative space. I wanted to really focus on the ocean. And so as often as possible, I let the water create the geography because that’s the space that we’re less familiar with, less usually sort of aware of. And so there’s a map of ocean dead zones. There’s a map of sea level rise in cities, and both of them are created purely– maybe, actually, I might be wrong about the dead zones map. Anyway. Some of the maps are created purely by the climate change impact. The cities around the world that are going to be inundated by sea level rise define the outline of every single continent. There’s very little, except for Antarctica, that is not outlined on that map. So that shows in a very particular way how much risk and vulnerability there is.
RT: Yeah. It’s an incredible way to sort of hammer that home in my mind. So props to you.
CC: Thanks. [laughter]
RT: It’s beautiful. Going from these maps, these tactile maps that you’ve painted, they’re physical. They’re real; I guess you can sort of say. And going from that visceral medium to that printed page, what were some of the biggest challenges of doing that? And maybe conversely, what actually might have been improved by having them printed in a book versus displaying them in the flesh?
CC: Yeah. That was super challenging for me, not being a super digital person. So these are actual physical objects they just finished displaying at a gallery here in the Bay Area. I think they’re really, really beautiful in person. They cast these lovely shadows that they’re translucent. The seaweed itself has this great texture. So that’s my personal preference, being an analogue kind of a person. And layering those maps digitally is so hard sometimes. But I just did my best. And I think some of them– yeah, they did turn out stronger for it. And it was always a little bit of a mystery to me because that was kind of a new format for me to work in. So it was definitely a challenge, and I’m probably glad I don’t have to do it anymore. [laughter]
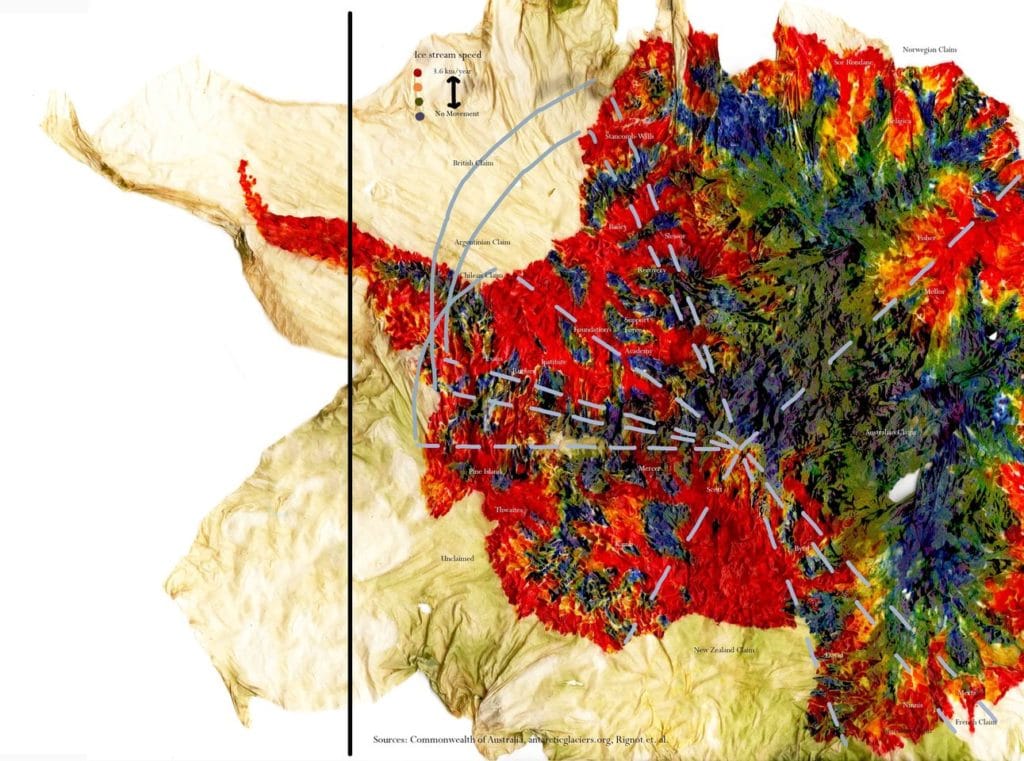
RT: Well, you answered my next question too, is that I was really inspired. My colleague Alan McConchie sent me this picture as I was doing the research of this Antarctica map of the ice stream speed that you have in there. And it looks much different as a photograph than it does in the book. And it was, like you said, very tactile. The shadows sort of play into things. And so you said that they were just on display, and I’ve missed it now.
CC: Oh, well, yeah. It’s okay. [laughter] There’s a wonderful little gallery in Oakland called Round Weather Gallery. And I’m going to give them a plug because they give a significant portion of all sales to climate change charities. That’s their whole focus. And Chris Kerr is the curator there. He’s put together some great shows. And yeah. So some of the maps were there. And I’ll happily display them again in other formats. They’re very, very delicate, of course, which is the kind of the beauty and tragedy of them, is that they’re not going to be around forever. But that’s kind of the point to me.
RT: Yeah. I love that as well. You sort of explicitly state that in the introduction, is that even if water gets on them, the map’s gone, and it’s sort of ephemeral.
CC: There you go. [laughter]
RT: It feeds that metaphor. [laughter]
CC: Yeah. Yeah. Yeah. We’re all just passing by. [laughter]
RT: So looking back on the maps that you made for the book, how do you think that maps sort of made in this fashion that maybe are radically different from some digital maps, maybe a little bit more artistic too, can change the way people think about maps and make maps in the future?
CC: Well, that’s a very good question. I’m very involved now in this kind of regenerative culture space where we’re trying to write new narratives and imagine what this future is that we’re walking into that’s never been before at a scale and in a way that is really beyond imagining. So it’s an interesting, challenging space. People really are, I would say– even artists are really challenged right now to figure out how we literally and figuratively map this future. And I think it could be great to do more collaborative work with cartographers, with designers because I think, yeah, artists are good at this kind of imaginary indeterminate space of not knowing and trying things out. And there’s just a real need right now in this space for figuring out how to create visualizations and interactive community, participatory mapping, future casting. All of this stuff needs to happen a lot. And some of us are working on it and bringing together other artists in conversation around these issues.
I’m leading a group right now on a new network called Deep Transformation Network. It’s a mighty network that is looking at this paradigm shift idea, how are we going to get there, and what do we need to do, at every level, from the individual to the societal to the political, all of that, to write these new stories, to enact them? And I’m also involved in a group called the Global Regeneration CoLab, also based here in the Bay Area. But the GRC, again, is another network of a couple of thousand people working hard on this. And we don’t have the answers yet, but we’re gathering– I think the process of gathering is happening in the past couple of years, as in so many other spaces, but this is the next challenge.
RT: Yeah. that’s awesome to hear. And I will make a reminder too to send you some of those sort of speculative cartography maps that I’ve seen too. Conspiracy of Cartographers is on Instagram and Twitter. And Jeffrey, who runs it, he sort of takes a lot of these historic topographic maps and shows them with sea level rise. And sometimes the sea level rise is not even necessarily possible. It’s more than what would happen if we had as much ice melt as we could.
CC: Yeah. There was a map put out by Burrito Justice, which is another blog of San Francisco, when all the ice melts and the six islands that remain. [laughter]
RT: Yes. Yes. Exactly.
CC: But I guess I’m very interested in the near future. And so actually, the fiction of Kim Stanley Robinson, I don’t know if you’ve read his books, but he is a masterful– in earlier lives, he did sci-fi on Mars and things. But his last two books have been really, really profound because– one’s called New York 2140, and it’s about New York in 2140. And the great thing about him is that he’s done his homework. Everything in there is super, super accurate. And also, he has this kind of hopeful pragmatism. He knows that people are going to continue. The world doesn’t go anywhere. We adapt. We change. There’s bad times. There’s good times. And we all keep going. And so the New York 2140 is great because it has the typical New York characters. It’s got the cop, and it’s got the asshole finance guy, and it’s got the street kids. [laughter] And it’s just the story of then, right? And it’s just the story of 50 feet of sea level rise when downtown Manhattan is Venice. Everybody has boats. This could be the future, literally.
And his most recent book is called The Ministry of the Future or The Ministry for the Future, starts in 2025. And it’s fantastic because it’s about a UN agency whose job is to help us navigate this near future and what happens between heat waves and eco-terrorists and the politics of international cooperation. What’s going to happen in the next 20 years? And again, extremely well-researched and entirely plausible but in this way that doesn’t make you want to kill yourself. [laughter] And just a wonderful book. So he’s my go-to guy in terms of, how are we going to do this? And we just need a lot more people who focus on this idea of the plausibility of civilization rather than the whole dystopian thing just doesn’t interest me at all.
RT: Right. Yeah. And it kind of circles back into our conversation earlier of getting these topics into different outlets of our consumption, whether it’s games or it’s books or it’s movies, that not necessarily lean on shock value, but let’s talk about what’s real, what’s going to happen. And if we’re thinking about it, like you said, right now in the 2020s, which in the book you said is sort of like our last best decade to potentially actually do some real change, it’s really important for us to sort of consume that right now.
CC: Yeah. I mean, I also– that is true. And also, we are always able to change our trajectory forever, right? So I don’t like the doomsday talk that is too common about if we don’t do everything by 2030, it’s the end of time. So I have to be hopeful. I have young children, and I do have genuine reason for hope, given the research I’ve done and some of the people I’ve been meeting with and learning about and talking to. So we don’t get to call all the shots, but we can make a difference where we are.
RT: Well, thank you so much for chatting with me about all of this and putting that forth into this social sphere that we’re tapping into as well.
CC: Cool. Thanks.
RT: For me, I found the maps to be so stunning and unique and inspiring, and I’m inspired myself to think about how I map in different ways. So if the legacy in cartography is nothing more than this, I just wanted to say that I attended grad school with a cartographer named Chelsea Nestel who had done some great artistic work with human bodies. And I had always thought about that as sort of separate from my simple mapping of the Earth. But now, after reading the book and really learning about this metaphor, and I guess it’s not really a metaphor – it’s a reality of the planet as a living being – and thinking about how I map and sort of being more thoughtful in that connection with the areas and phenomena I map.
CC: Oh, that’s fantastic. Oh, that’s really great to hear. I mean, yeah. We talk a bit in the book about the ocean as a body and about how the systems in the ocean do actually correspond. And I really do believe this. I mean, the ocean has a circulatory system. The ocean respirates and gets sick. It’s approaching critical condition right now and gets fevers, and areas are dying. So it pays, I think, to think in this kind of more empathetic way about living systems, more interconnected way, as you’re saying. And I encourage people to do a little thinking and reading in this field. Gaia Theory is really well-developed right now. Systems Thinking Theory is closely related and very relevant. And it really turns all of the stuff we were taught about man being essentially competitive and the survival of the fittest– it turns a lot of that stuff on its head. Science has come a long way, and thinking has come a long way in the last 150 years. So I encourage people to check out some newer thinkers. Like Bruno Latour is a really great French thinker. There are many others. So check it out.
RT: Yes. Yes. And I know you dropped a couple of those names in your sign-off acknowledgment–
CC: They’re in the book.
RT: –in the book too. [laughter] So if you’re listening, go check out The Atlas of Disappearing Places from your library or from a bookstore. And thank you so much, Christina, for this conversation. It was wonderful.
CC: Thank you so much. It was really great. [music]
RT: Thank you for listening to PLN8. Thanks to Christina for our conversation today. This episode of PLN8 was written by Alan McConchie and myself, Ross Thorn. Music for PLN8 was created by Julian Russell. You can find The Atlas of Disappearing Places in bookstores or your public library right now. For more of Christina’s work, visit her website at christinaconklin.com. If you liked the show today, we’d be so grateful if you shared this conversation with friends, family, and other folks who might find it interesting. You can also tell us on Twitter at Stamen using the hashtag PLN8. For a summary and full transcript of today’s conversation, along with some other visual examples we talk about in the episode, check out the blog post at stamen.com/blog.