
Why use a map?
Imagine a map of your hometown. Seeing that a creek runs along main street or that there are connecting side streets running adjacent to that one highway with the notorious stoplight is the kind of spatial information that could meaningfully impact your life.
Now imagine a map of a town you’ve never been to and have no plans to visit. Seeing the location of a grocery store there may or may not be interesting or useful.
Now imagine a map of the moon. The proximity of one crater to another is hard to comprehend when you can’t even fathom the scale of the craters in question.
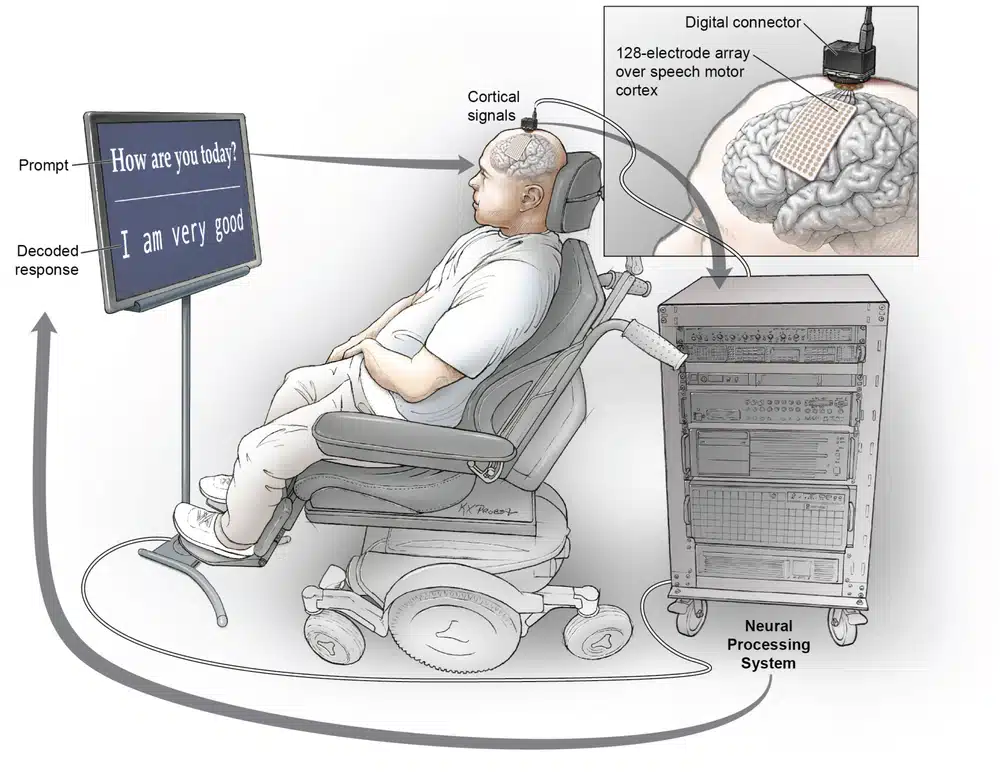
Having spatial data (knowing where something is) isn’t always the same thing as needing spatial data (caring where something is). This was the initial question we explored with the Chang Lab at UCSF when we began working with them to visualize their cutting edge research of how speech is produced and processed in the human brain.
Figuring out whether information is useful can’t be done without identifying who the information is intended for. A surgeon holding a scalpel certainly needs to know as much as possible about the best location to cut. But will they be pulling up this interface as they head into surgery or even for reference during training?
Researchers in a lab may need to analyze their data and identify location-based patterns in their findings. In that case, having the maximum possible amount of information indexed and juxtaposed could lead to an incredible internal tool.
A general audience, however, may not need to know the precise coordinates of where our brain perceives vowels but will still find it fascinating, which lends itself to a different kind of visualization than the surgeons or researchers would find useful.
In addition to needing to be interesting, visualizations also provide an opportunity for researchers to demonstrate where they have made breakthroughs that contribute to the greater collective knowledge of the human race. In science there is an inherent open-endedness that allows for unexpected revelations alongside the expected. So withholding spatial data possibly becomes a missed opportunity to engage and enlighten.
How is a brain like a mountain?
Even if the spatial dimensions of the brain aren’t our primary focus, there are some useful visualization parallels that we borrowed from cartography:
SAME: The earth and brains both have surfaces that we are primarily interested in. Think about a topo map, and how in some circumstances we are interested in the variance of the elevation, but in others it’s more about net distance from A to B. The brain is the same way, with the dura mater (outermost membrane) representing the vast majority of brain topography, and the altitude of the sulci and gyri (ridges and grooves) being lesser priority.
SAME BUT DIFFERENT: Brain pathways behave more like a transit map and less like a road network. Neurons transmit information more like a Greyhound connecting two cities, while bundles of axons send signals akin to a dense interstate highway.
DIFFERENT: Regions are relative, and locations in the brain are not fixed. When brain function is lost in a certain area, the functions previously associated with that location can migrate to new and variable regions.
SAME: There are additional dimensions beyond the surface that have crucial importance, though exposing those details can be distracting. Like how including an indoor floorplan of an airport could distract from trying to find the airport in the first place, or the bathymetry of the ocean floor would add noise to a map being used to fly from California to Japan. Being able to surface additional detail when and if it is relevant becomes crucial.
Another critical dimension for understanding the brain is time, which though it can be represented as a dimension of space, doesn’t have to be.
What is time?
There are so many visualization forms that use time for added excitement and interest, though it’s easy to overwhelm the user when displaying time using time via animation. For example, in so-called bar chart race visualizations you get to watch different bars increasing in size over time, but because the only way to see change over time is to literally watch every second of the “race”, it’s easy to lose all of the time-based revelations by the end of the sequence.
Another problem that arises when representing time with animation, is that sequence is captured but additional context about the scale or precise timing is easily lost. Including an animated timeline can help, but then you are effectively asking the user to watch two animations simultaneously.
And when visualizing something like speech that we are so accustomed to experiencing in real time you lose some flexibility when it comes to slowing it down or stretching it out, because doing so turns the speech into something unintelligible. This leaves us with the conundrum of wanting to associate our visualization to speech to make it familiar, but then having to pick between an intelligible visual or an intelligible audio output. In this case, we decided to rely on coupling a spatially-defined animation with a simplified data animation where time was represented as the x-axis to ideally get the best of both worlds.
The next frontier?
Aside from the representation of space and time, we also wanted to capture the known v. unknown aspect of the research. This gave us our final visual attribute, which was to create a mental model (no pun intended) adjacent to stars in space, which cartographically feels the most relevant for this exercise.