
While there’s beauty in the act of observing the world, there’s more than a little artistry in the practice of deciphering and communicating it. Weaving several complex threads into a coherent visual narrative can be quite challenging and sometimes you need to find someone who can help you make sense of it all! In this episode, Catalina Perez, information designer and longtime Stamen collaborator, talks about her transition from teacher and architect to interdisciplinary designer and how she’s carried her passion for explaining things into crafting visual communications.
By a stroke of Craigslist luck, Catalina found and began renting a desk space at the Stamen Design Mission headquarters when she first moved to San Francisco, thus beginning a glorious collaborative relationship with the studio. In 2018, Stamen commissioned Catalina to paint a mural to adorn a wall in the communal work space, an area that’s also used for daily shared meals.
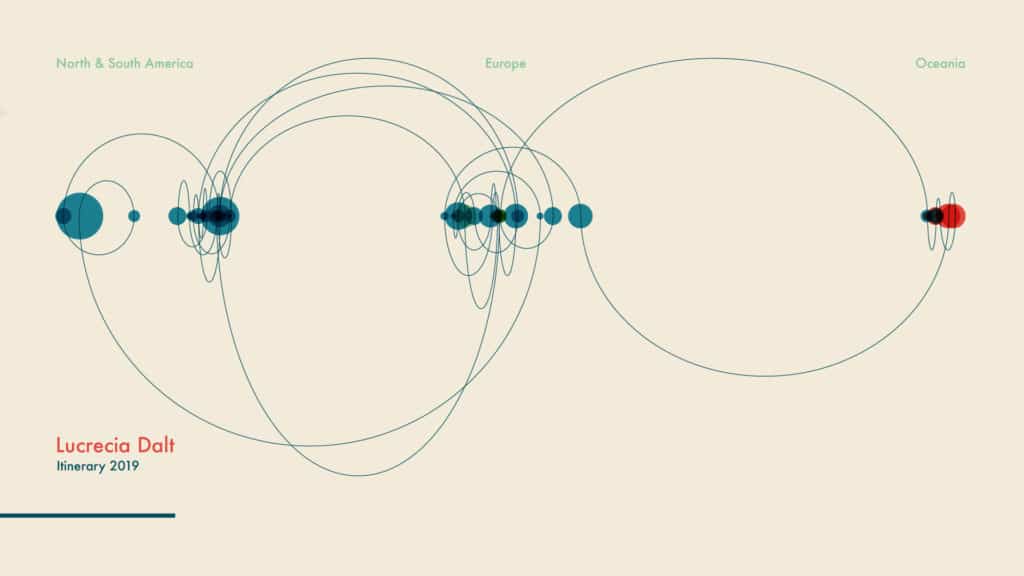
Catalina works with a range of clients every year in addition to maintaining her own practice as an artist. Occasionally her worlds overlap, and she gets to work on projects that marry both personal and professional – like a recent piece she did visualizing performance data for experimental musician Lucrecia Dalt, who also happens to be Catalina’s sister.
You can check out more of Catalina’s incredible work on her website!
Transcript — +
You’re listening to Pollinate, a podcast on data, design, and the people that bring them to life. Brought to you by Stamen Design.
Amira Hankin (AH): Embracing illustration as a daily practice, architectural floor plans for learning visual communication, and how to find your creative community through a Craigslist ad. These are just a few of the things you’ll hear about in today’s episode. My name is Amira Hankin, and I’m an experience designer at Stamen. Today, I chat with one of Stamen’s collaborators. With that, please welcome my guest.
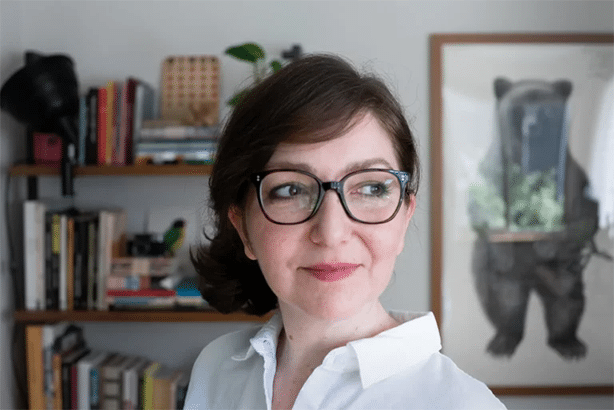
Catalina Perez (CP): My name is Catalina Perez. I am an information designer and an illustrator, and I am one of the regular collaborators at Stamen.
AH: Welcome to the podcast, Catalina. Thank you so much for being a guest.
CP: Thank you for having me, Amira. This is great. I’m really eager to do this.
AH: As am I. I’m so excited to be chatting with you today. And there’s a lot that I want to ask you about, but I’m hoping that, to begin with, you could just talk to me about your background and sort of how you ended up doing what you do, what your educational history looks like, and anything else that sort of feels relevant to work that you do now.
CP: I was just thinking that it’s such a long story that I don’t know if you’re going to have enough time, but okay, here we go.
AH: Give it a shot.
CP: My background is architecture. I am actually an architect, and I then did a master’s in art history. For a good part of my professional life, I was a teacher. I was teaching design principles and design history and art history at a design school, and I feel very, very, very passionate about the act of teaching and explaining. That is something that I really love. So I have always been also passionate about drawing. The thing about the school that I went to when I went to studio architecture, they used to structure their syllabus by workshops. So when you started an academic year, you had a specific theme to work in. It could be as simple as building a small house or creating an urban plan for a city, depending on the level that you were in. But they all had in common that at the beginning of the year, you were assigned that theme. You were assigned a desk that became your office, and then you had to work with a partner.
CP: And normally, the execution of your project, once the conceptual part was approved and everything and you had to deliver the project, normally, that execution has two parts. One was the three-dimensional model, and the other one was the drawings of the floor plans and sections and elevations, and I always choose the part of the drawing. I was totally fascinated about the power of this idea, that it’s a set of visual languages and conventions to explain something that is as complex as a project that is an architectural project. So I think it’s a mixture of this idea of something that I really love to do that is explaining stuff and this thing that I learned from a very technical standpoint that is drawing floorplans, and—all architectural drawings..
AH: So were you doing illustration alongside all of those more architectural drawings? Or was that something that you discovered later through that process?
CP: No, actually. It was because of architecture that—I started to draw every day. I started to have an illustrated journal. It was one teacher that I had, a very influential person in my career. His name is Alberto Moreno. And he was a big intellectual. And he was the kind of teacher that was talking about an urban project, but at the same time, was explaining to you the principles of jazz? And then at the same time, he was explaining to you that it had a lot to do with some painting, and whatnot. And he encouraged us to have a notebook. That we needed to carry all the time. To draw everything that we were seeing, because he was like, very—emphatic, all the time. Explaining that we needed to observe the world. And try to decipher it. And because of that, I started to draw on a regular basis. And then, when I started to draw, after the fact, after I was teaching, after I was working as a professional, I kept drawing all the time. And then it became kind of natural. I was living in Barcelona, and some people saw the drawings, and then they published one, and that happened, in a very natural way, I think.
AH: That’s wonderful. I love that idea of art as a daily practice. And finding ways to incorporate that into your day-to-day routine. And daily drawing, do you still do that?
CP: I don’t do it on a regular basis. I try to do it when I go to visit a new place, or when I go on vacation. I try to keep an illustrated journal of those trips. Because the thing that happens with something that you decide to draw is that it’s so selective. Like, you really are making an effort, and maybe an unconscious exercise of selecting what is the most important thing that you want to do. And it’s always so beautiful when I go back to the drawings of my trips, or the places that I visit too. Because when I share it with the people that I went on that trip with, sometimes people don’t remember that. But when they see the drawing, and it really brings us a sweet memory. Because that exercise of abstraction and selection that you do when you decide that something needs to be drawn.
AH: It’s wonderful. You mentioned that part of what you love about drawing is the communication aspect of it? It sounds like you’ve always been thinking like a communication designer and information designer. And I am wondering, did it feel like a very distinct pivot to move from architecture and art history towards illustration in terms of a career? Was there a specific moment where that happened? Or did it just kind of happen gradually?
CP: It happened gradually, but I have to say that in my mind, those limits are not very sharp. Those limits are kind of blurry. Like if I could go back in time, I think I would go back to architecture school. And I would study in the same school that I went to because I think that everything that I know about visual representation and visual communication, I learned there. So it was such a beautiful moment, and I think it has been very influential. I have a tendency to understand everything as a whole. Even now, when I introduce myself, I say that I am an information designer and illustrator, but I only do that for the rest of the world, [laughter] because in my mind, they are not that different, or at least the kind of illustration that I do. Because the kind of illustration that I do is very explanatory. It’s always serving an explanation, something that needs to be like an idea that has to be communicated. It’s not the illustration that is like an editorial illustration that is going to be the art part of a text.
AH: I love that you are happy working in this kind of blurry space. Or you might even argue it’s interdisciplinary. There’s crossover between illustration and information design with anything and everything, which is what’s so beautiful about it.
CP: I don’t think it’s an idea that is very popular [laughter] when you are describing what you do in such a broad way. And also because normally it’s difficult to explain what you do. It’s not like you’re saying, “I am a dentist.” That is like, “Okay, that’s what you do.” So it’s blurry. It’s like, yeah, [laughter] sometimes it’s hard to understand.
AH: So on that note, how would you describe what an information designer does and what you do or what kind of services you’re able to provide?
CP: Yeah, that’s a very good question. I think that information design, like the value at its core, is the idea that is successfully communicated from a visual standpoint. Of course, we are talking about very blurry lines when you talk about data visualization or information design or, in my case, illustration. But I think that when it comes to information design, the most important part is the ability to tell a story. The visual storytelling part of it. The idea that you have to be concise enough and visually compelling enough in order to represent a complex idea. I think that the clarity of communication is a key part of the information design.
AH: What does that look like? Being familiar with your work, I feel like I have a good idea of the range of what that can look like. But I’m wondering if you could describe what are the outputs from this? What is the range here?
CP: It’s so wide because when you talk about visual information, the very first thing that people think about is infographics. That, of course, is a very effective way to represent something in a visual way. But when it comes to the different branches that come from visual information, it can also be directions, maps. For example, cartography, in general, has a lot to do with visual information and less to do with data visualization. So that part of being able, for example, in a map to communicate where things are, the size, the shape, the colors. All those things that you have to take into consideration are a pure terrain of visual information.
AH: That sounds really interesting. It sounds like it can be anything from something that really is data-driven to something that is a lot more about storytelling and maybe more conceptual in nature when you talk about infographics or something that’s more of a visual journey that you’re walking somebody through.
CP: Yeah, that’s true. And I think that might be the big difference between information design and data visualization. Of course, most of the things that I do are data-driven. But normally, the complexity of the data that I’m working with is not that complex. It’s not that big. Why, when you’re working with complex projects of data visualization, that is like the key point of it. I think in both cases, the most important part is really caring about that visual message that you’re going to communicate and direct.
AH: There’s so much, I mean so much I want to ask you about your process, really, and the tools that you’re using. But actually, I mean, taking a step back, I would love to know more about your history working with Stamen, and how you began that working relationship and how that’s evolved over the years.
CP: I moved to San Francisco in 2016. I’m terrible with years, so I don’t remember, and I’m sorry about that. The thing is that when I moved to San Francisco, I didn’t know anyone there. I moved there for family reasons. And then what I decided is that I needed a place to go to work. I needed to get out of my house because I didn’t want to spend my days working from home in a city that I didn’t know anyone because I knew that what was going to happen is that I was going to be working all the time, and I was going to be missing all the day-to-day activities. I had such a specific—I had such a specific idea back in the day. I was looking for a design studio that was renting a desk in their studio. So I couldn’t find it because that’s not that normal. I just had this idea because I had a bunch of friends in Barcelona that had this business model. They are a big designer studio, but their space was huge, so they rented out desks. And when I moved to San Francisco, I was all the time looking for places to go to work. And the only thing that I could find back in the day was co-working space that were very tech-driven and with a tech personality and everything.
And then one day I found an ad on Craigslist that said something like, “We’re a design studio. We’re renting a desk. We are a design studio in the Mission District.” That was perfect for me, the location. “We are design studio and we love plants and maps.” And I was like, “What’s this? [laughter] What’s this sign from heaven? This is very weird.” So I went to see the place, and I loved it, of course, because the Stamen office is so beautiful. It’s so eclectic. It has so many layers. And I was like, “Yes, this is the place that I want to visit that I want to work in.” And then I ended up renting a desk there. So I was a Stamen tenant for a while. When I went to see their space, what they were proposing was to rent me one of the closed offices that they have. And I was like, “No, no, no, no. I just want to be in the middle of everything. I need to see people.” [laughter] So I ended up working next to the studio manager that was right before Eric Rodenbeck’s office. So I was there in the middle of everything.
And one of the things that I love the most about going to their studio is that Stamen has a very solid tradition of having lunch together. And I say we because I was part of it. We stop at noon, and we go buy lunch, and then we go and sit together around the table and we have a conversation. That was very intriguing to me, the fact that no one talks about their job at this lunch. It was just a conversation about…I don’t know…current events, what’s happening, what are we watching, what are we listening to. So my professional relationship with Stamen started because we became friends first. We were friends, and then because I was in the middle of everything and I assumed that they were seeing what I was working on all the time on my monitor and everything. There came a moment that they needed more illustration on a project than data visualization. And they asked me to do it, and it was the beginning of this beautiful relationship that I really cherish. And it was amazing. It was amazing because it was something that I wasn’t even looking for intentionally. But when it happened, it made so much sense. It was perfect.
AH: I love that story. And I think that it’s such a beautiful thing that we found you and you found us in this really organic way. And you mentioned, actually, that this is something that you have friends doing in other parts of the world, this idea of renting a desk somewhere that was just inspiring. And I hope that can become more common here [laughter] And eating lunch together, just to have these moments where you can draw inspiration from the people around you. Not just the work that you’re doing, but the people and the personalities.
CP: Yeah. That’s true. Yeah. That’s so beautiful. Because actually, I had the opportunity to meet them all from a personal standpoint. There was a very long period of time that I had no idea about their roles in the company. I had no idea. I knew about the designers because that’s a common language and that’s kind of easy to decipher. But when it comes to other roles in the company, I had no idea who was a permanent collaborator or a contractor. I had no idea who was part of—who was an employee and who was not. Because I think that one of the most beautiful things about Stamen in general, is this personal connection that creates with their team. So it was really great to be part of it. And to be part of it from Monday to Friday, every day I was there. [laughter]
AH: There’s also something really poetic about one of the first ways I was introduced to your work, actually, which is this absolutely stunning mural…
CP: Oh. Thank you so much.
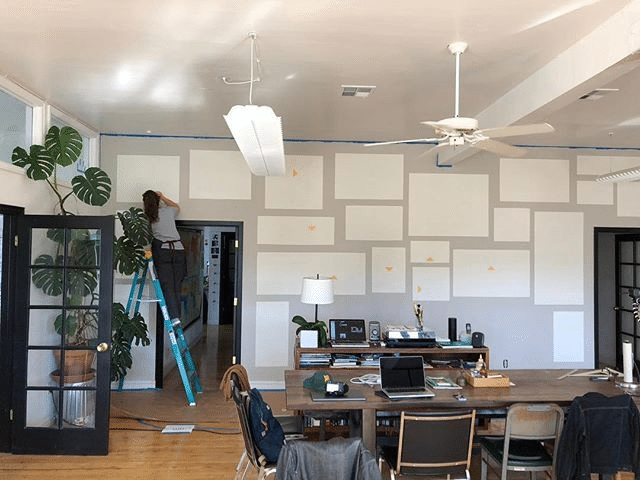
AH: …that you’ve done in the Stamen headquarters space. And it’s right around the communal dining table.
CP: That is their work space as well.
AH: Hard to describe without seeing it.
CP: Hard to describe. [laughter] Yes.
AH: Yeah. It’s a very open space. And there’s this absolutely gorgeous mural. And it’s, again, really hard to describe without seeing it. And we’ll make sure to post some pictures online. But I wonder if you could walk us through what that mural is and what that process was like.
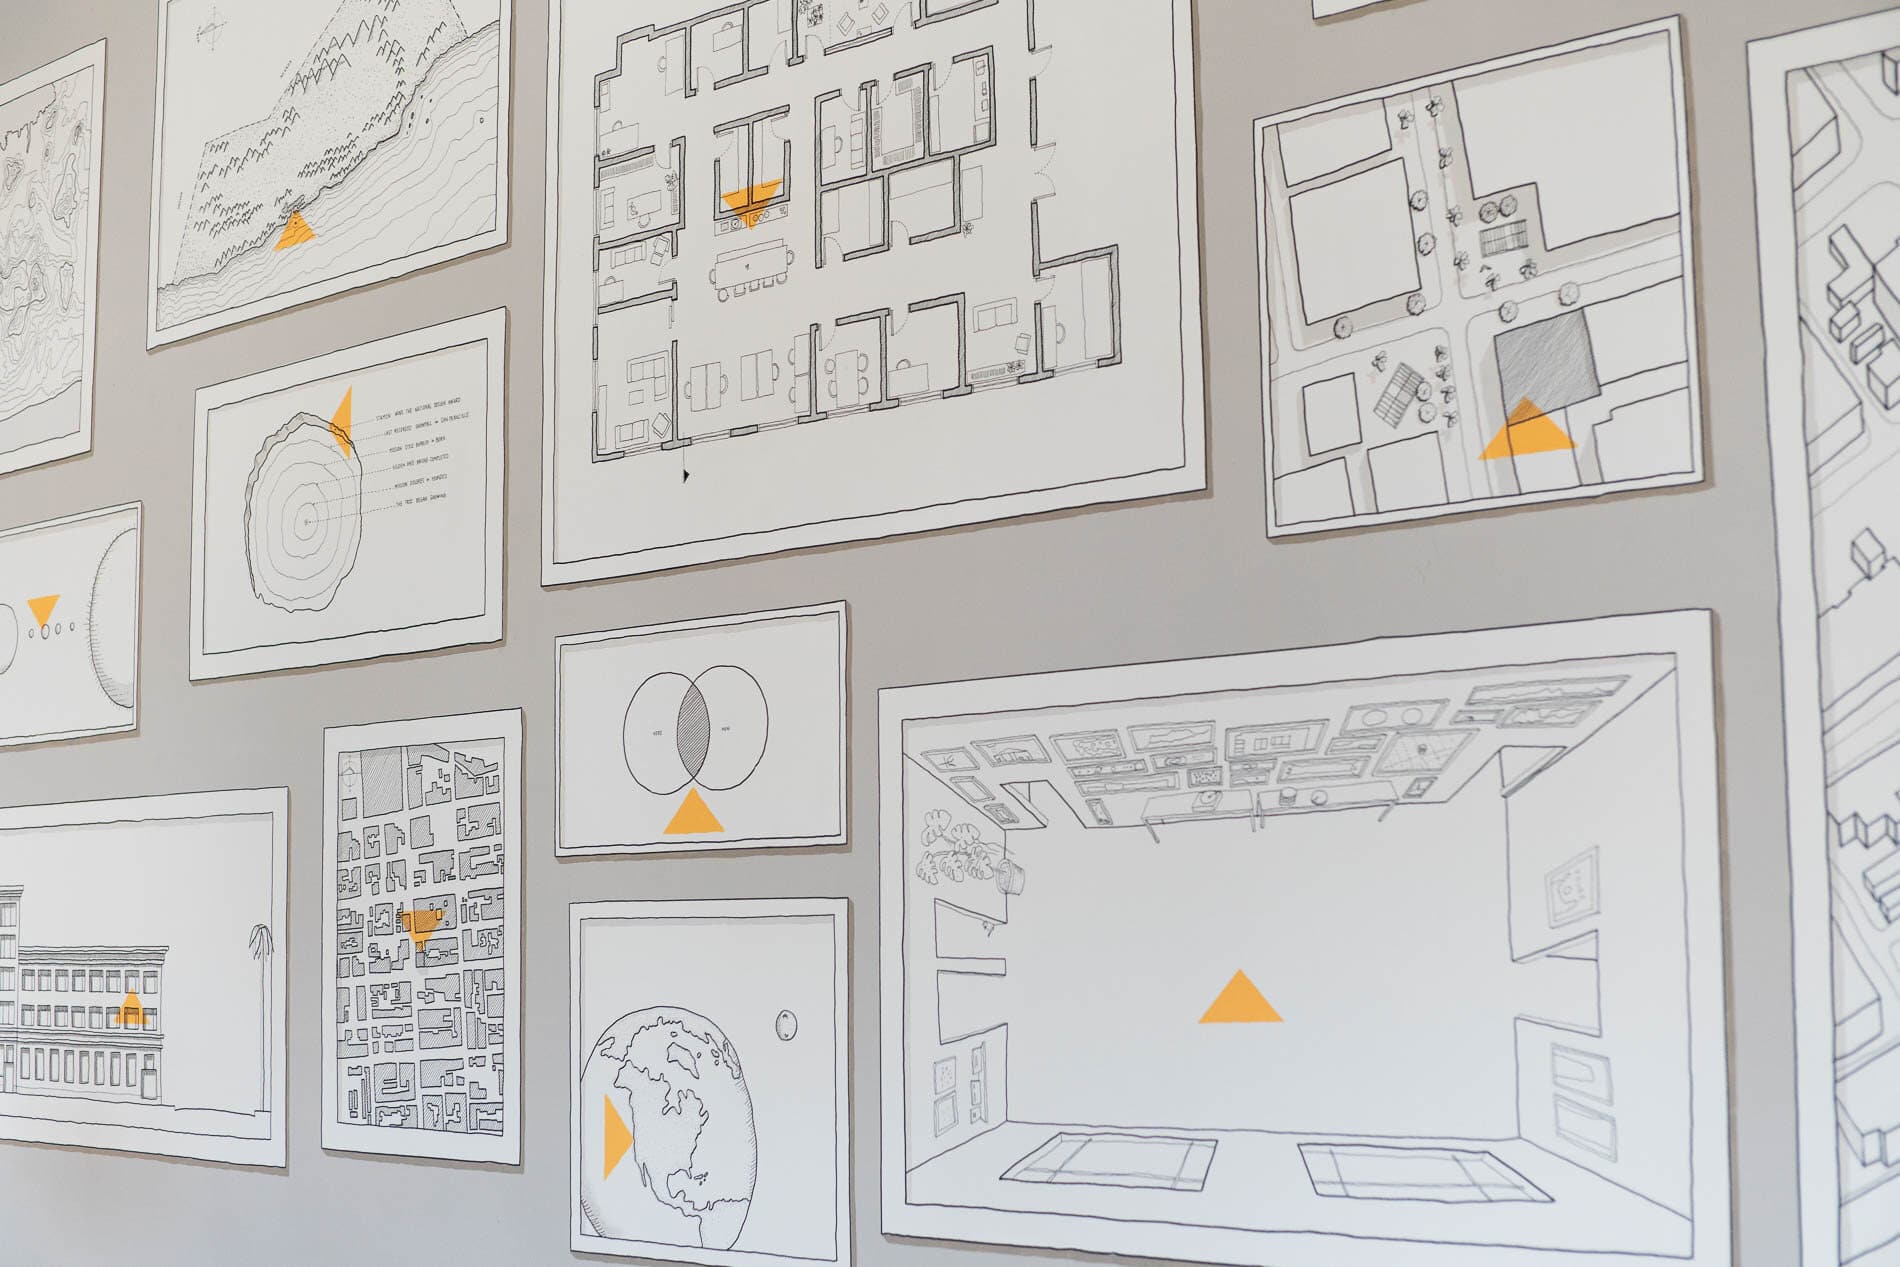
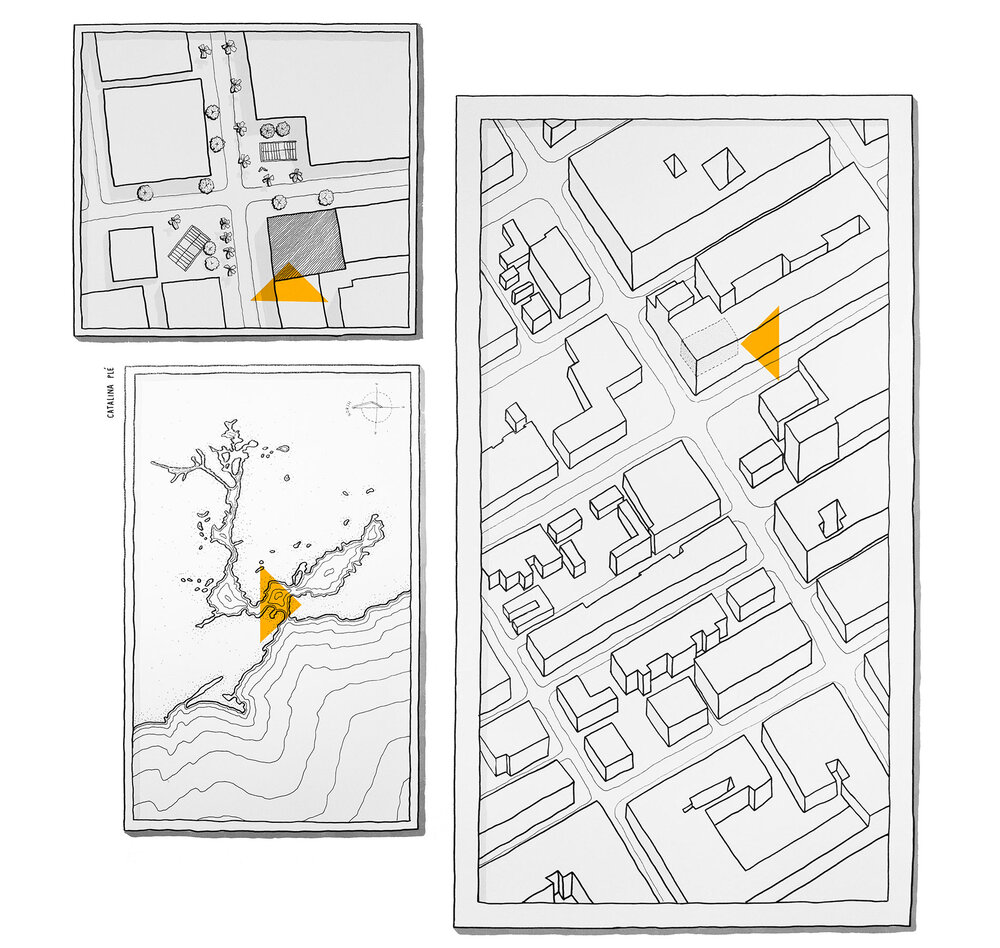
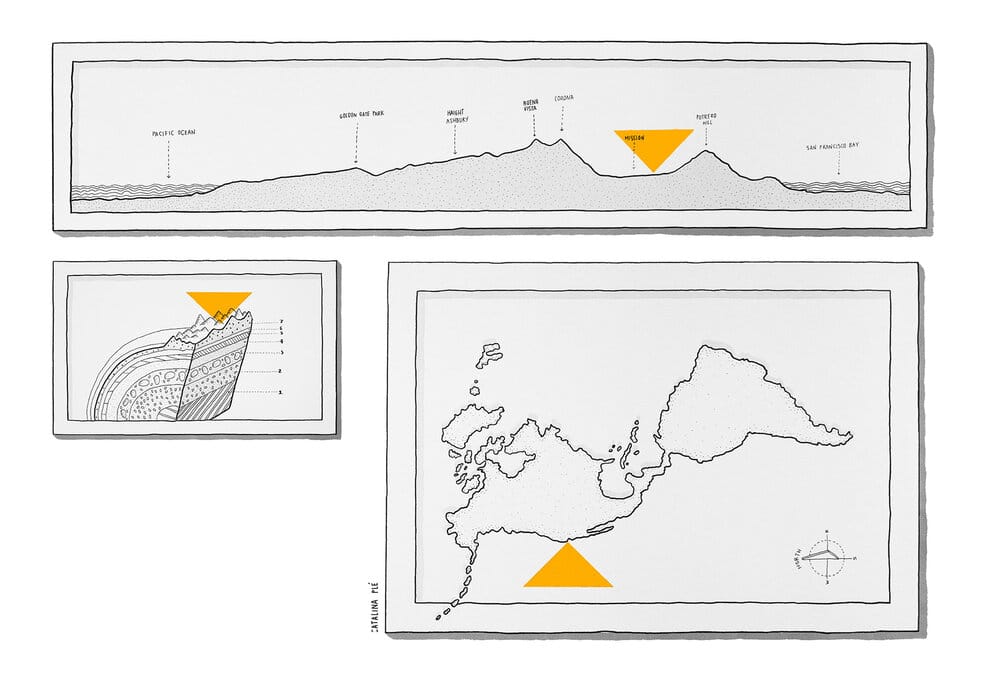
CP: Sure. It was so cool to do that project because it’s very easy to end up working in a digital space all the time. That’s very easy. So even going back to my journals and my notebooks feels so analog, [laughter] that sometimes it’s quite shocking. So I was commissioned by Stamen to create a mural in their main space. And at the beginning, they just wanted a mural. It was like that. The commission was like, “We want a mural.” [laughter] And I was, “About what?” And it was like, “Please bring some concepts and ideas.” So there was some back and forth with them. I really wanted to represent the Stamen essence. That is, “This studio from long longevity that is doing data visualization and maps.” And I started to think that since maps are such a fundamental part of the Stamen’s work, I wanted to create something that was a meta situation of that. If this is a studio that is working about maps and about the fact that you are visualizing something, how can you do something that is accurate for them?
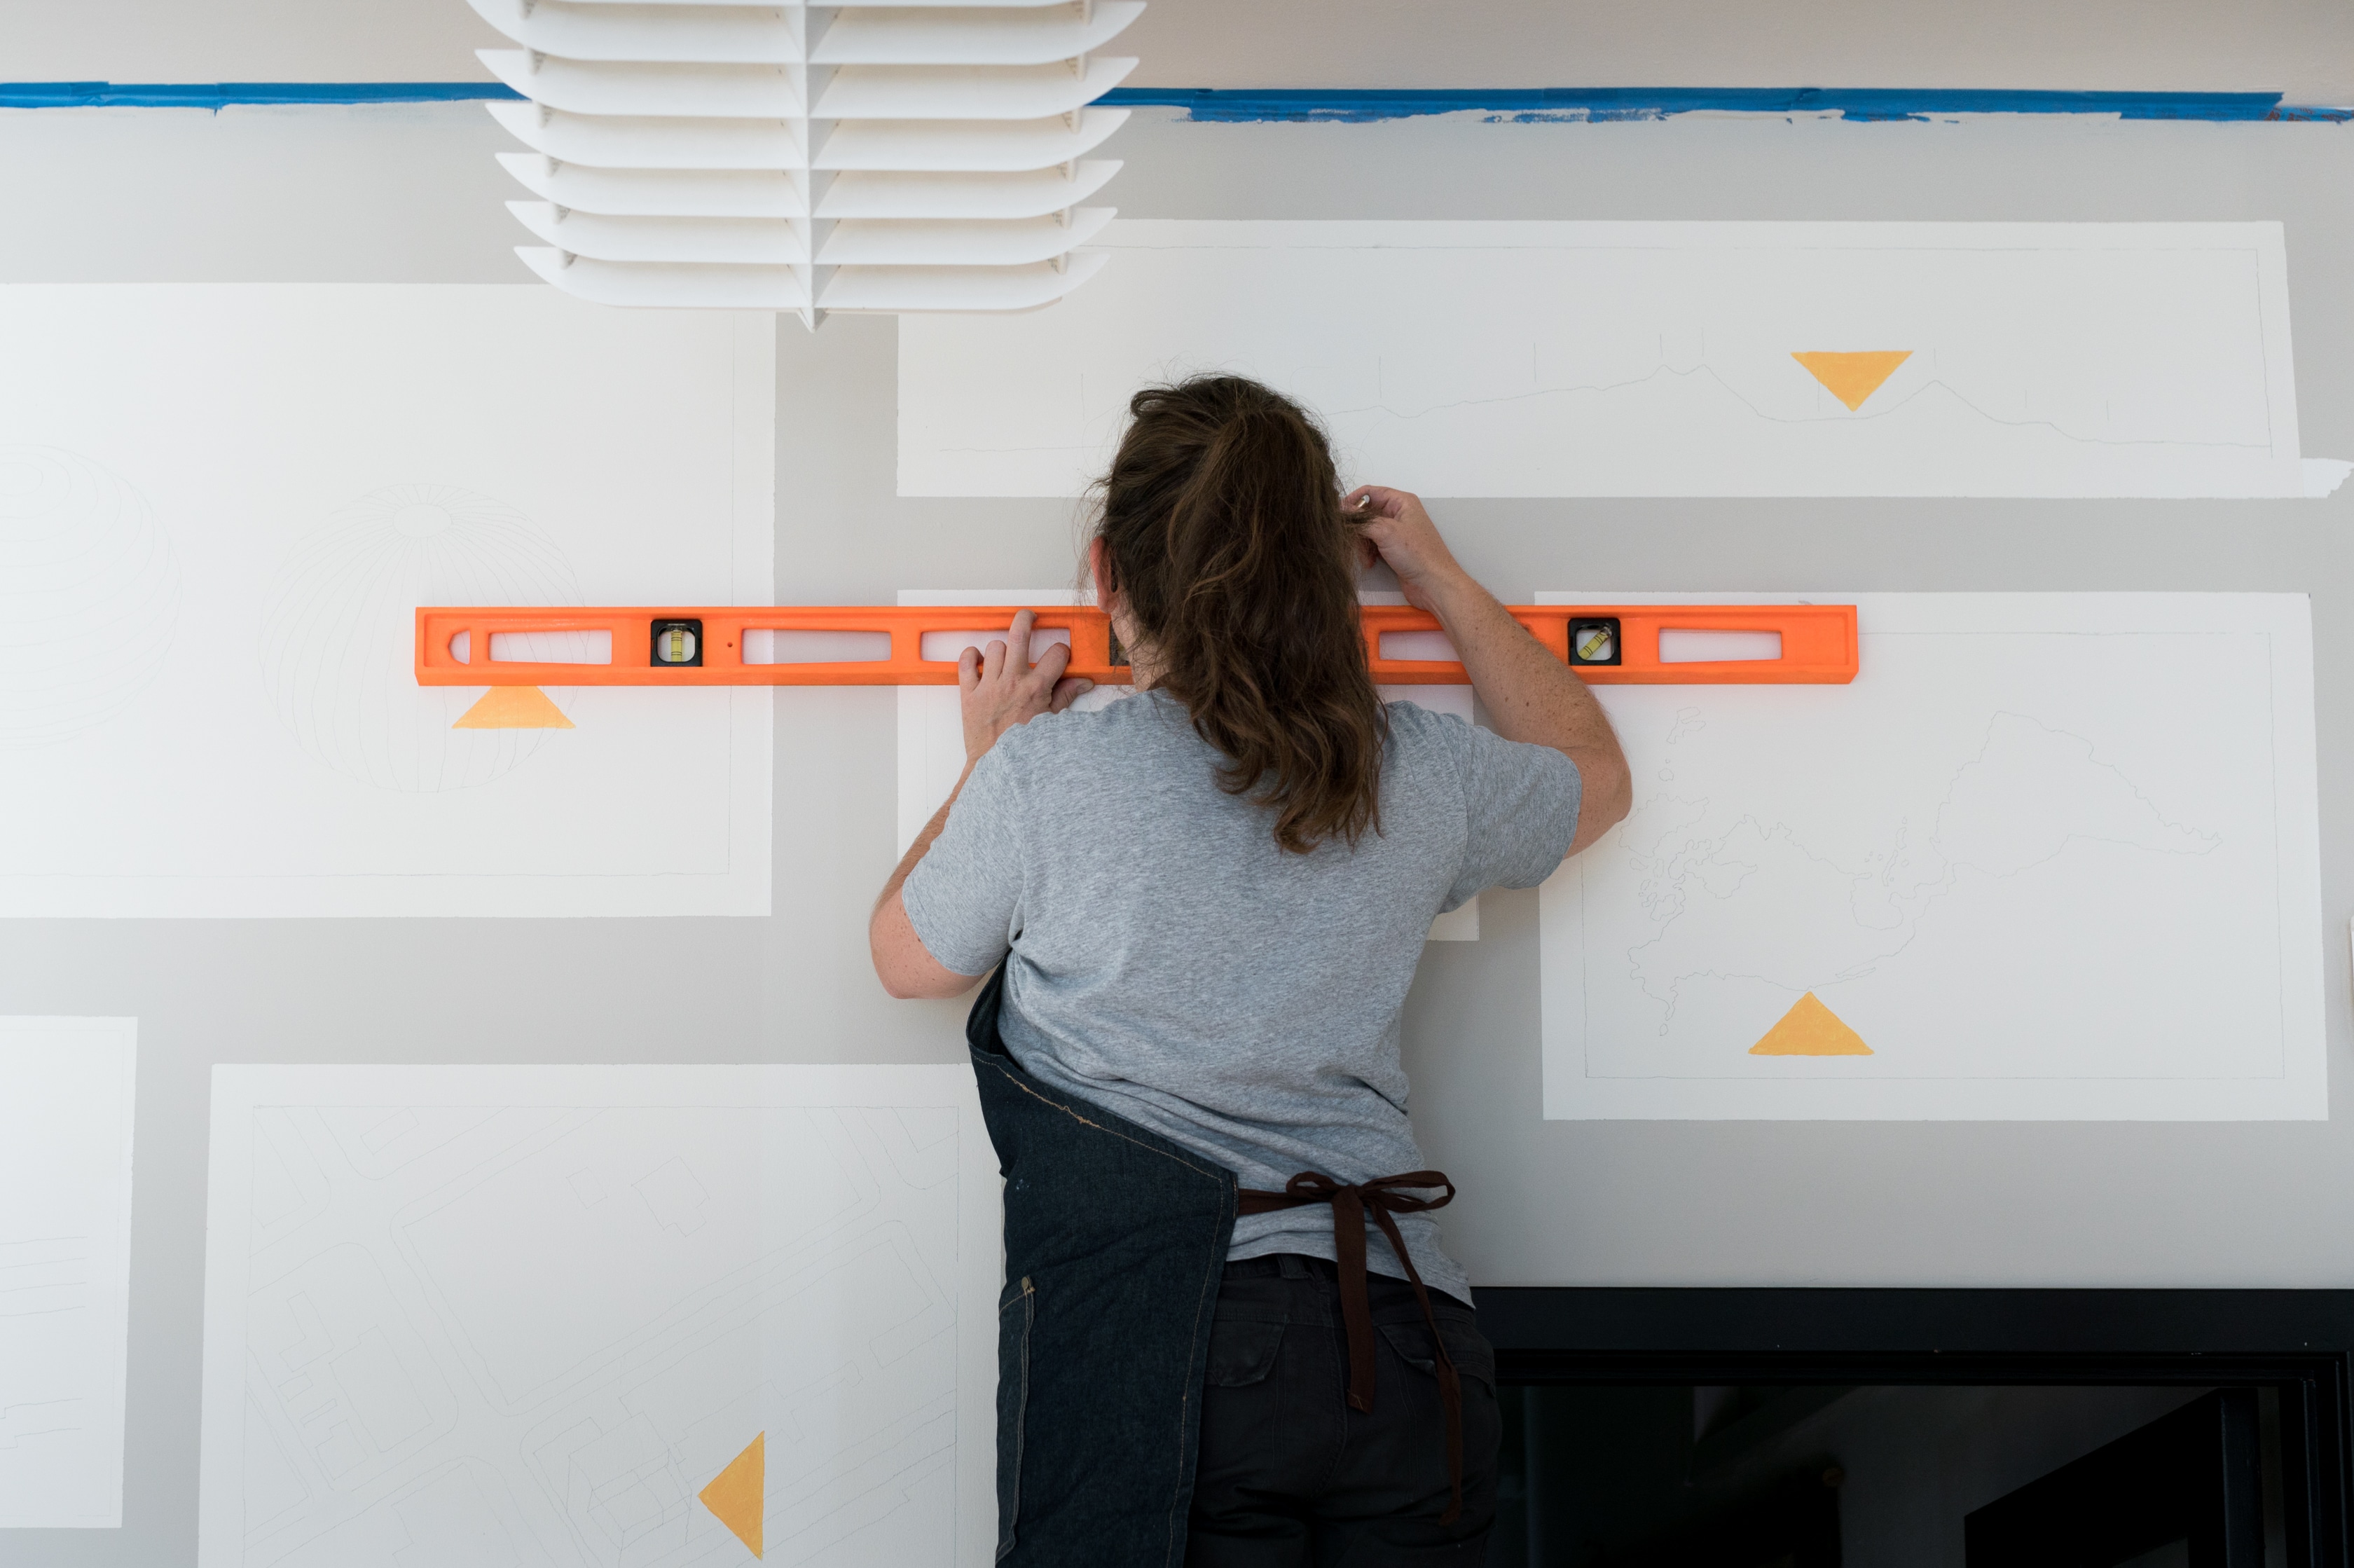
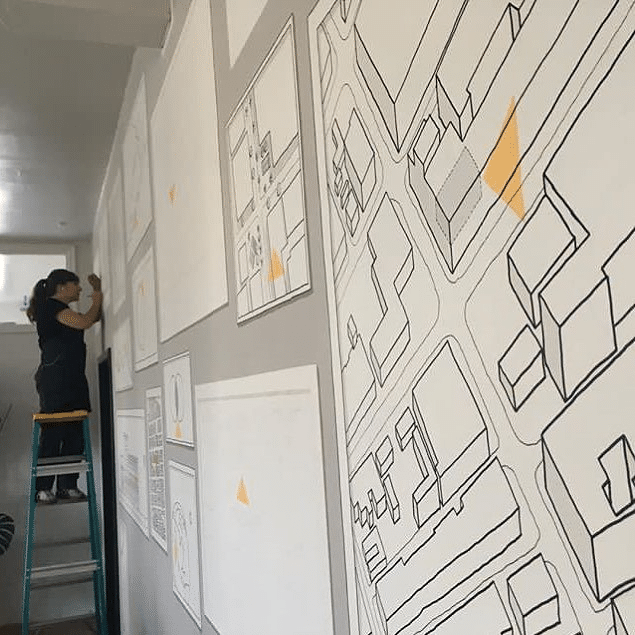
So I created this mural that works like a grand gallery. Like one of those galleries that have different pieces of art that are small and big. That was the first part of it. And I wanted to represent this concept of, you are here. Every time that you see a map. The ultimate goal of a map is showing this relative position. So I wanted to show in this different art pieces different diagrams and maps of the statements, location and relative position. But in order to do that, I ended up using topographic maps, urban maps, floor plans, sections. I used geological layers. I used diagrams, Venn diagrams. It’s like a collection of different ways to represent that. And I think that from the most visual standpoint, something that was very important to make the project, is that we wanted the mural to be present enough that was there.
But since this space, as we mentioned, is where everything happens, I didn’t want it to be visually loud, like something that is all the time very, very present. So the colors are very neutral. And I think that the most challenging part from the technical standpoint is that it is freehand and hand drawn entirely. So the challenging part of making it was the fact that I was, for example, drawing hatch lines that were as detailed as something that I’m going to do on paper. But I was drawing on a wall, so it took a while. I think that they were very patient, because I think that the estimation of the project in the beginning, to me, it was like, “Yeah. Give me three days and I will finish.” And it was like a week of me in the middle of everything trying to be like a fly on the wall. But, I mean, it’s impossible. I was painting. It was kind of a mess, but it was such a good experience to be there in the middle of the space painting.
AH: It is so wild and lovely to me that you were asked to make this mural. That must be what, 20 feet by 15 feet wide.
CP: You know, Amira, that I only speak in the metric system.
AH: Oh, right. What was it in meters?
CP: I know for a fact—I know for a fact that it’s seven and a half meters, and two and a half meters high. You, my dear and beloved Americans, can do the math.
AH: Whatever system we’re using, we’re talking about a large-scale mural here. An entire wall. And what is so wonderful to me is that you did use tools that you were familiar with, and that spoke to your process and philosophy as an illustrator. You used these fine—this fine line work and these paint pens to create these really, really richly detailed pieces. And I’m wondering what that was like for you to work on that scale with this tool set that you’d been using on a much different level.
CP: It was challenging, because I used a lot of paint at the beginning. It has a lot of layers of paint. It’s not quite noticeable, because there are different layers of a very pale gray. That is what is making the optical illusion of what is happening there. So that part was challenging, because, really, painting is not my natural medium. But when I started the more detailed part of it that was drawing in freehand on a wall, it was fascinating. I basically was listening to music and standing there hours. I had to stop only because it’s such an unnatural way to position your body to draw that I was having a stiff neck all the time, because you are drawing on a wall. But yeah, it was challenging because it was huge. It was challenging because calculating the time that you’re going to spend doing it—it was weird. You don’t know how long it’s going to take you to fill a wall. But from this technical standpoint, I was having a blast because having the opportunity to draw freehand for so long, it was such a good experience. I loved it.
AH: And I’m sure that differs very greatly from your process and tools for any digital work that you’re doing. I’d love to know more about that end of the spectrum, too. As we think about projects that you’ve done that are more in the infographic realm or the data visualization realm, what does that process look like for you?
CP: Of course, it’s different. I think that one of the most fascinating things about doing what we do is not only the conceptual part that I always enjoy a lot, but the part of working with the tools that you have in front of you is so beautiful. Every time that there is new software or something that you have the opportunity to explore, I really love it. And I love it as much as when I discover a new kind of notebook that has a different kind of paper. It’s something that gives you a new opportunity to create new stuff. So in the case of the more digital data visualization projects, the process really is not that different at the beginning, because I always start with a sketch. Everything that you see in a digital form has its version as a sketch that I have done in one of my notebooks. And then what is beautiful about all the computer-generated graphics is the precision and all this flexibility.
And mostly when you are so used to working freehand or with your hands in general, this possibility of undoing [laughter] is fantastic. I know that I’m sounding like a grandma here, but when you really work in those two different worlds—it’s so funny because I use this tool to draw in my iPad that is called Procreate, and they have these gestures when you have to undo the thing that you just did that you don’t like. So you just tap your screen with two fingers. And I have discovered—I have found myself when I’m drawing on my notebook sometimes doing the same gesture of tapping the paper with my two fingers, because that’s so engraved in your memory muscle that it’s right there. But it’s not, of course, it’s not going to happen. It’s so funny and frustrating. [laughter]
AH: What are you working on these days, either for Stamen or personal work? What’s exciting you about work that you’re doing?
CP: Right now I’m working on a project for a company in Spain. I cannot really talk that much about it. I think this answer is very boring because most of the things I can’t really talk about [laughter]
AH: It’s the blessing and the curse of client services work. What about any personal projects that you’re either working on or have done recently?
CP: The personal project that is an ongoing thing for me is my journals. That is one of the things that I cherish the most. And it’s not that recent, but one of the personal projects that I have enjoyed the most is working on a project of data visualization that I did for my sister. My sister is a musician, and in 2019—she’s a musician, and she travels a lot. She’s touring all the time. She performs in different places of the world. And I always had this feeling that music is so ephemeral, things happen, and it’s the beauty of it, of course. But since I am such a visual person, I wanted to collect all this information and make it visual. So I made this project. I convinced her to collect all—create a data set that has all the places that she went to and the size of the audience and the type of performances that she did. She’s an experimental musician. So she was doing, back in 2019, concerts but she was also doing a project about life soundtracks to music.
And so, I wanted to create a visual narrative that will explain all of that. How many people went to see her? How often were the concerts close together? I wanted to see that because it’s so fascinating to me, this kind of life and these kind of experiences that she had. So after that, I made this project that not only gave me the opportunity to explore digital data visualization project, but the opportunity to work close with my sister. And the final result of it’s a video that is an animated data visualization that also has her music. When the piece was finished from the visual standpoint, I sent it over to her and she created an original music for it. So it was such a complete experience. And it was like a long project that took a while, and it took several stages of it. And yeah, that is the most complex personal project that I’ve made.
AH: I bet that was really cool for her to be able to see this data represented in some way. And I’m wondering, did you come across any interesting stories or moments where you were like, “Wow, this is when this particular thing happened.” Or anything like that.
CP: I don’t think we had something like that at the moment, but what was very surreal is that this year that I represented was 2019. So when I finished the project, it was 2020, middle of the pandemic. Musicians are not traveling, they’re not touring, they’re not having live performances. So when I finished this project, it looked like I had made a project of something that happened a while back because she—but by that moment, she was not performing that often. And it was very weird to see this thing, how intense it was, and then all of a sudden, it wasn’t. Like a visual representation of something of a reality that is no longer there.
AH: Wow. To see the absence of data [crosstalk] in this case. Yeah. So what is next for Catalina? [laughter] What are you looking forward to working on? Or are there kind of dream projects that you’re thinking about? Dream data sets, dream clients, that sort of thing.
CP: Oh, I don’t know. That’s a tricky question. I think I am an optimist that is very unclear about the future. I know something good is coming, but I am not able to make it in a concrete form. My expectations will be to keep collaborating with the same men. I really love to work. The clients that we work with and the kind of projects that we have. I am very enthusiastic about maps in general and this possibility of visual communication in maps. But I also enjoy so much the more simple information graphics that I think—that in an ideal world, I will keep doing a mix of complex projects and more simple projects. It’s something that I really enjoy and I really hope to keep doing.
AH: Thank you so much, Catalina. It’s been so lovely talking with you. [music] You’ve been an awesome guest.
CP: Thank you so much, Amira. I really appreciate this opportunity, and I thank you for all your questions and everything. I really appreciate it.
[music]
AH: Thank you for listening to Pollinate. Thanks so much to Catalina for a great conversation today and the most thanks to Ross Thorn for production of this episode. Music for Pollinate was created by Julian Russell. You can see more of Catalina’s work by going to her website at catalinaple.com that’s catalina P-L-E.com and can also go to stamen.com/blog for a summary and full transcript of today’s episode, as well as to see images of the beautiful mural we talked about.