
This summer, I’m working on a Creative Code Fellowship with Stamen Design, Gray Area and Autodesk. The project is called Water Works, which will map and data-visualize the San Francisco water infrastructure using 3D-printing and the web.
Finding water data is harder than I thought. Like detective Gittes in the movie Chinatown, I’m poking my nose around and asking everyone about water. Instead of murder and slimy deals, I am scouring the internet and working with city government. I’ve spent many hours sleuthing and learning about the water system in our city.
In San Francisco, where this story takes place, we have three primary water systems. Here’s an overview:
The Sewer System is owned and operated by the SFPUC. The DPW provides certain engineering services. This is a combined stormwater and wastewater system. Yup, that’s right, the water you flush down the toilet goes into the same pipes as the the rainwater. Everything gets piped to a state-of-the art wastewaster treatment plant. Amazingly the sewer pipes are fed almost entirely by gravity, taking advantage of the natural landscape of the city.
The Auxiliary Water Supply System (AWSS) was built in 1908 just after the 1906 San Francisco Earthquake. It is an entire water system that is dedicated solely to firefighting. 80% of the city was destroyed not by earthquake itself, but by the fires that ravaged the city. The fires rampaged through the city mostly because the water mains collapsed. Just afterwards, the city began construction on a separate this infrastructure for combatting future fires. It consists of reservoirs that feed an entire network of pipes to high-pressure fire hydrants and also includes approximately 170 underground cisterns at various intersections in the city. This incredible separate water system is unique to San Francisco.
The Potable Water System, a.k.a. drinking water is the water we get from our faucets and showers. It comes from the Hetch Hetchy — a historic valley but also a reservoir and water system constructed from 1913-1938 to provide water to San Francisco. This history is well-documented, but what I know little about is how the actual drinking water gets piped into San Francisco. homes Also, the San Francisco water is amongst the most safe in the world, so you can drink directly from your tap.
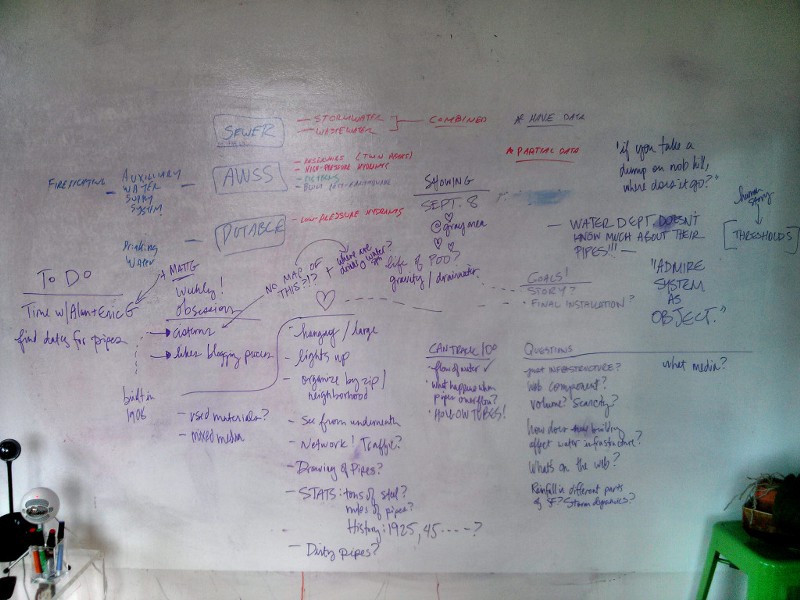
Given all of this, where is the story? This is the question that I asked folks at Stamen, Autodesk and Gray Area during a hyper-productive brainstorming session last week. Here’s the whiteboard with the notes. The takeaways, as folks call it are, are below and here I’m going to get nitty-gritty into process.
(whiteboard brainstorming session with Stamen)
(1) In my original proposal, I had envisioned a table-top version of the entire water infrastucture: pipes, cisterns, manhole chambers, reservoirs as a large-scale sculpture, printed in panels. It was kindly pointed out to me by the Autodesk Creative Projects team that this is unfeasible. I quickly realized the truth of this: 3D prints are expensive, time-consuming to clean and fragile. Divide the sculptural part of the project into several small parts.
(2) People are interested in the sewer system. Someone said, “I want to know if you take a dump at Nob Hill, where does the poop go?” It’s universal. Everyone poops, even the Queen of England and even Batman. It’s funny, it’s gross, it’s entirely human. This could be accessible to everyone.
(3) Making visible the invisible or revealing what’s in plain sight. The cisterns in San Francisco are one example. Those brick circles that you see in various intersections are actually 75,000 gallon underground cisterns. Work on a couple of discrete urban mapping projects.
(4) Think about focusing on making a beautiful and informative 3D map / data-visualization of just 1 square mile of San Francisco infrastructure. Hone on one area of the city.
(5) Complex systems can be modeled virtually. Over the last couple weeks, I’ve been running code tests, talking to many people in city government and building out an entire water modeling systems in C++ using OpenFrameworks. It’s been slow, deliberate and arduous.Balance the physical models with a complex virtual one.
I’m still not sure exactly where this project is heading, which is to be expected at this stage. For now, I’m mining data and acting as a detective. In the meantime, here is the trailer for Chinatown, which gives away the entire plot in 3 minutes.