
Stamen is officially retiring Map Stack, a platform we previously hosted that gave everyone a straightforward way to mix and modify raster base maps.
What was Map Stack?
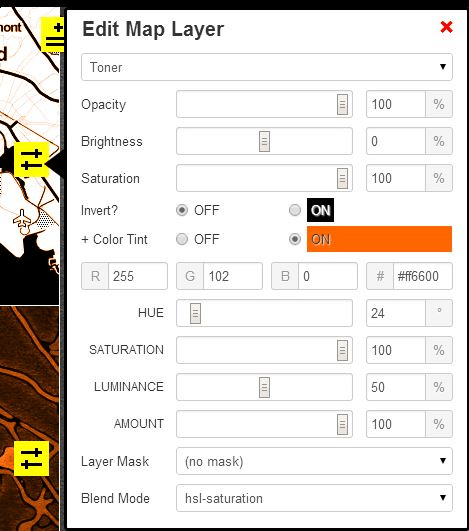
Created in 2013, Map Stack gave you an interface where you could select from a variety of raster base maps, tweak the images that made up the base maps, and layer (stack) those base maps to combine them. The kinds of changes you could make to a base map were similar to basic Photoshop functionality: you could change opacity, brightness, add a tint, and add a mask to hide/show parts of the base map.
Map Stack allowed users to pick from a few base maps including Stamen’s Terrain, Toner, and Watercolor tiles (now hosted by Stadia Maps, you can read more about this on our blog here), a satellite layer, and various feature layers (buildings, water, etc). Once you were done creating your stack of layers you could use your new base map tiles in your web map just like you would any other base map or you could generate a static image of your base map with Map2Image.
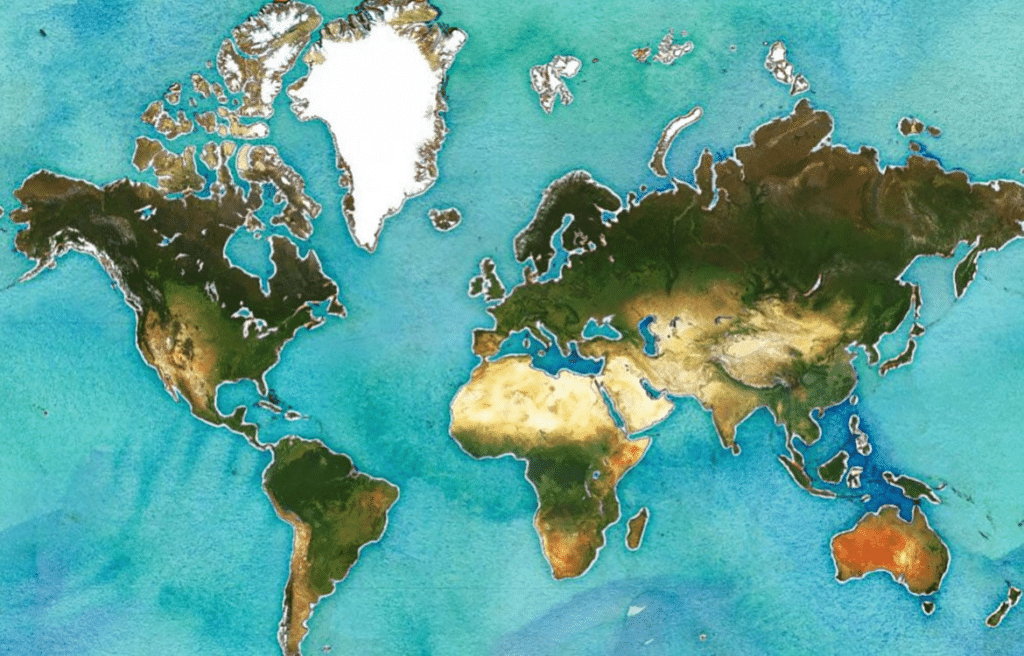
By combining base maps and masks you could do some really useful and sometimes wild stuff like mask out water on a satellite layer and replace it with the water from our Watercolor tiles:
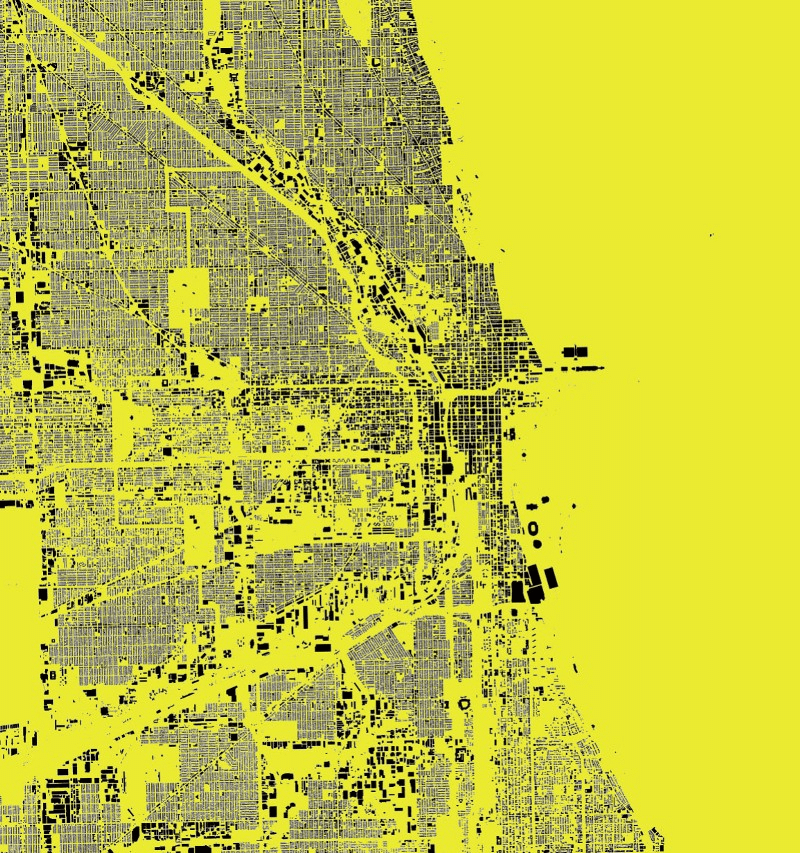
Or you could use a solid color background and overlay with a layer of buildings:
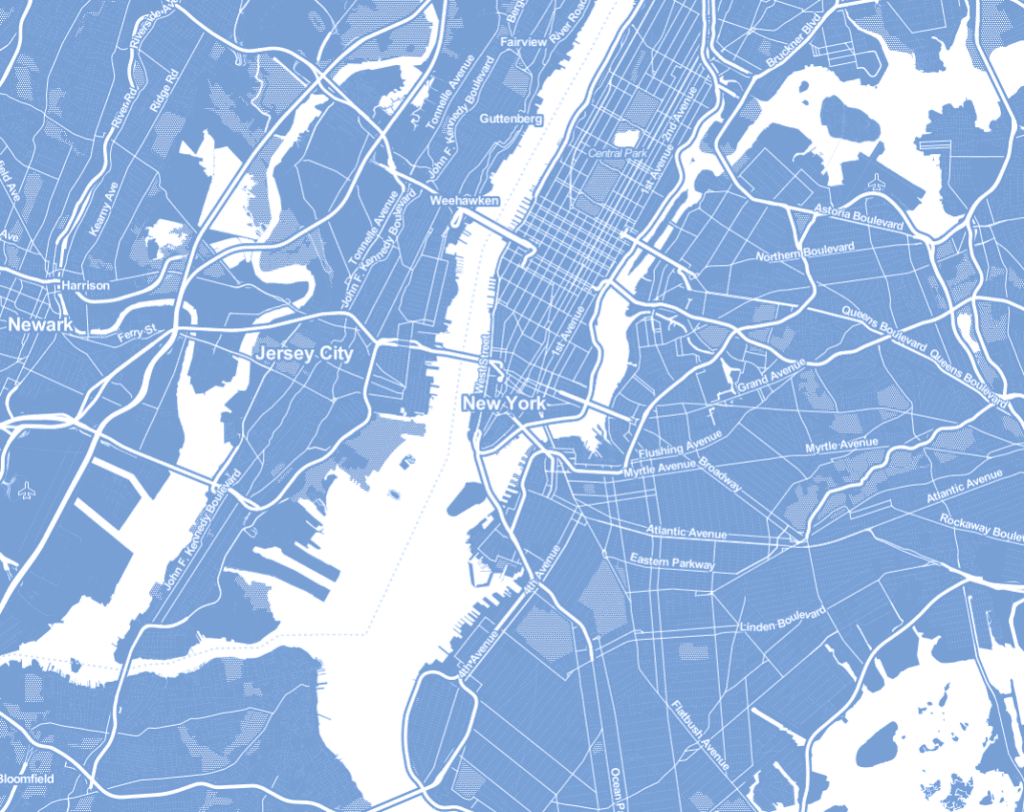
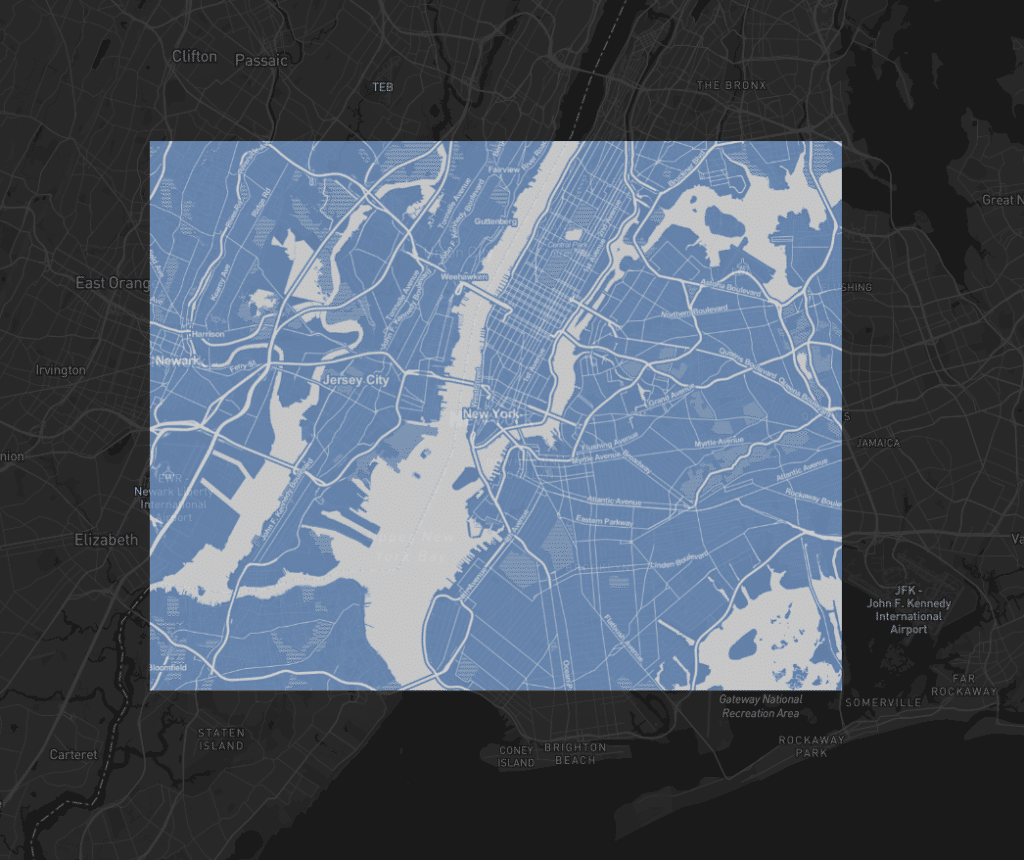
Or maybe you just want a blue take on Toner:
Here it’s worth noting that the original team that built the projects that drove Map Stack are no longer here at Stamen, notably: Seth Fitzsimmons was behind the server that stacked layers (internally sandwich-maker), Shawn Allen worked on the frontend interface (internally referred to as delicatessen) and Sean Connelley worked on Map2Image.
Why are we retiring Map Stack?
Map Stack was a massive step up for people who wanted to customize raster base maps without the knowledge and resources to do so, which were both substantial requirements in 2013. Today, with vector cartography, you can do much of the same styling–and with way more precision–with a variety of proprietary and open source tools.
From the beginning we were unsure that we could afford to host Map Stack:
We’ve decided, for the sake of Seth’s sanity, that Map Stack will be open for business Monday to Friday, from 11 a.m. to 5 p.m. PST until we can sort out what kind of infrastructure the project will need given the level of interest we’re seeing. […]
In its first day, viewers to the site generated about 10GB of map tiles — there are 10GB of new maps in the world! Which is great, but that’s a lot of tiles. We’re not getting paid for this — yet — and part of the project is figuring out what the business model might be.
Generating, hosting, and serving raster tiles gets expensive and is the main reason we had to discontinue hosting our own map tiles.
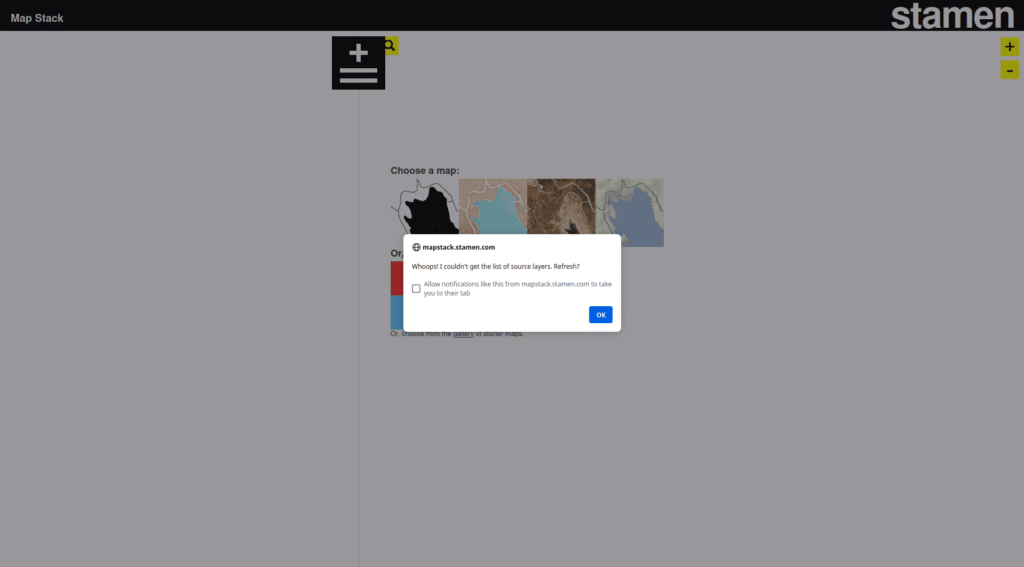
At the same time, maintaining Map Stack, a free service hosted by a small team, became a burden. Over the years a variety of deprecations (Python 2, HTTP, tile endpoints, etc) accumulated and when we migrated our own map tiles Map Stack’s functionality was inherently broken. At the moment if you visit Map Stack it looks like this:
While we could theoretically spend the resources to resuscitate Map Stack, we prefer to acknowledge that much of its usefulness was in the past and it had a good run of ten-plus years.
How/can we preserve web maps?
It would be nice if we could archive Map Stack in some usable state, but it would be unreasonable for us to expect it to continue functioning if we did. Assuming we did manage to get Map Stack running again there would be a fundamental question around how to deal with various web services Map Stack depended on migrating, being updated or deprecated, or disappearing generally. That is, most of what made Map Stack interesting and useful came from other services outside of Stamen’s control. We can’t assume or expect all of the base map layers Map Stack depended on to get the Smithsonian treatment and be preserved in perpetuity, for example.
At the same time, Stamen has not saved the tiles that were generated by Map Stack over the years. As our initial post mentioned, 10 GB of tiles were generated in one day, and we could not feasibly have kept all of those tiles in storage or paid for the bandwidth to continue serving them. So, unfortunately, tools that used Map Stack tiles no longer can load those tiles and have been partially broken.
It can be frustrating for those of us whose work largely exists online to watch the tools our projects depend on become deprecated and dissolve away. It’s an unfortunate fact of life online that the resources one would like to see persist are unlikely to stick around.
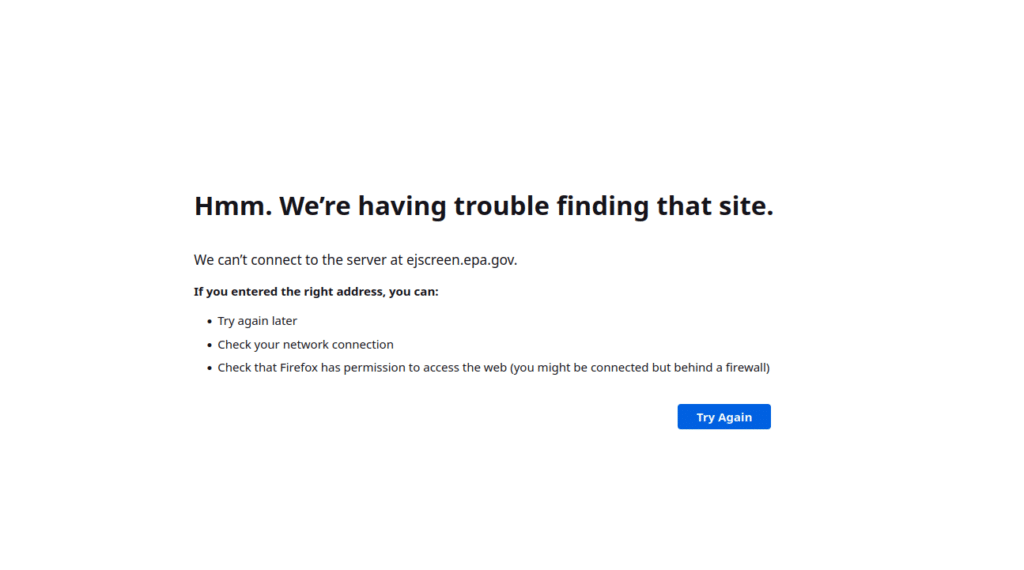
A study from 2024 at Pew Research Center found that “38% of webpages that existed in 2013 are not available today,” and while the study doesn’t reach conclusions about why this is, we can assume that often websites are moved or removed due to neglect or a lack of funds to continue paying for servers and domains. Today, in 2025, we’re contending with the intentional removal of pages at the hands of a federal administration that is purging government websites. While some websites can be mirrored and backed up in the Wayback Machine, data-heavy interactive pages such as web maps fare less well. This is the case for the EPA’s environmental justice mapping tool, EJScreen, which currently returns a 404:
In the Wayback Machine EJScreen is available in a much-diminished form–none of the data is accessible and the map only loads after a significant wait. It has been inspiring to see groups such as Public Environmental Data Partners launching mirrors of tools like EJScreen with the actual data intact. It’s a ton of effort and this mirror cannot begin to replace the impact of a dedicated team with funding to continue building a tool and dataset like EJScreen, but we’re still glad the data is accessible.
Even if you’re paying your bills and no one is maliciously removing resources you depend on, changes will likely eventually happen that break your web map. Ages ago, I had at least one project that used CloudMade tiles back when they closed off access to smaller users, and I appreciated seeing Mapzen make efforts to keep much of their work accessible as open source tools after they closed. Outside of a company pivoting or shutting down, APIs change, rates increase, and maybe some key part of your web map no longer functions.
As a teacher of many students over the years who have made web maps, I’ve increasingly shifted towards taking extensive screenshots of their work in order to retain some semblance of a record of the students’ projects. For those of us with access to more resources and technology, self-hosting map tiles (as Stamen has with projects like Mapping Historical New York) and using formats such as PMTiles can give our projects more resilience and longevity.
While Stamen doesn’t have the resources or interest to maintain Map Stack as a platform for remixing map layers, we believe we can do the next best thing.
Introducing Map Stack Stack
While the individual map tiles generated with Map Stack were not saved, we have saved many of the images generated with Map2Image over the years, and around half a million of those images were generated with Map Stack. We know a little bit about these images, just enough to give a sense of when they were taken and where on the globe they are focused. Specifically we have the date, center (lat/long), zoom, and image dimensions in pixels for each image.
Using these fields we can georeference the images on a web map. Here’s a Map Stack Toner variant from 2013, overlaid on a vector base map:
Georeferencing these is slightly complicated by the fact that we don’t have the extent of the images in latitude and longitude coordinates. But we can calculate these using the center point and determining the distance that a pixel at the image’s zoom level and latitude should cover.
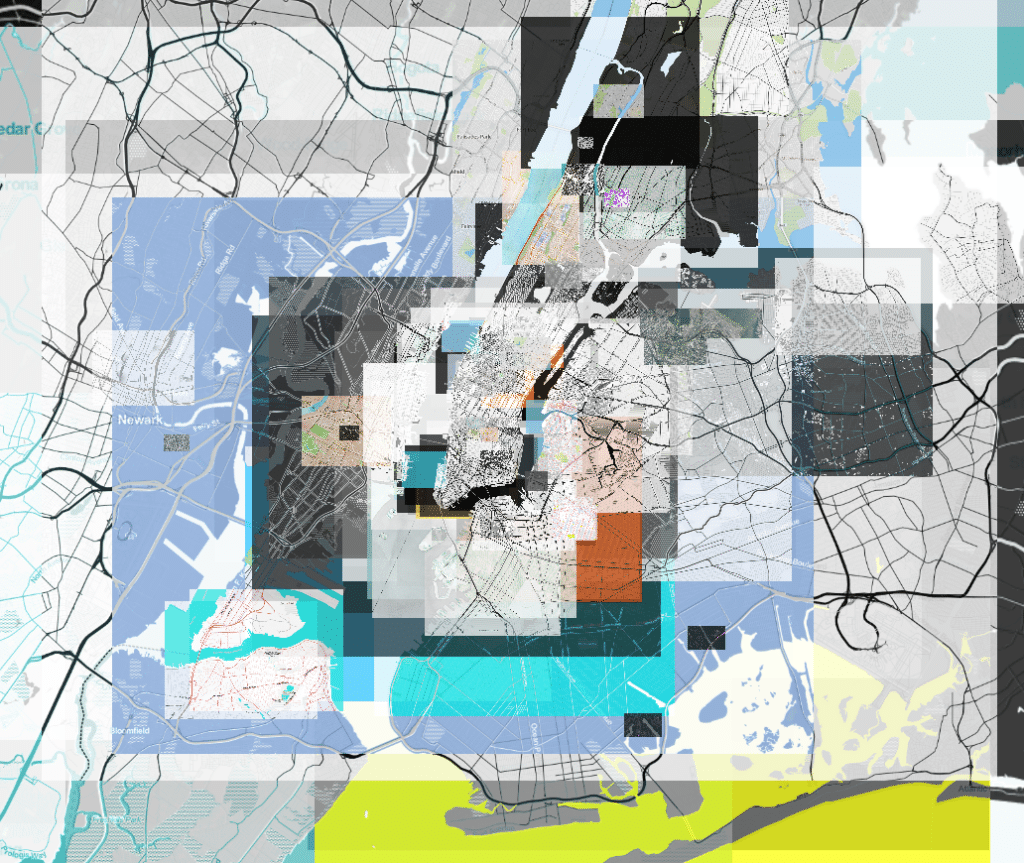
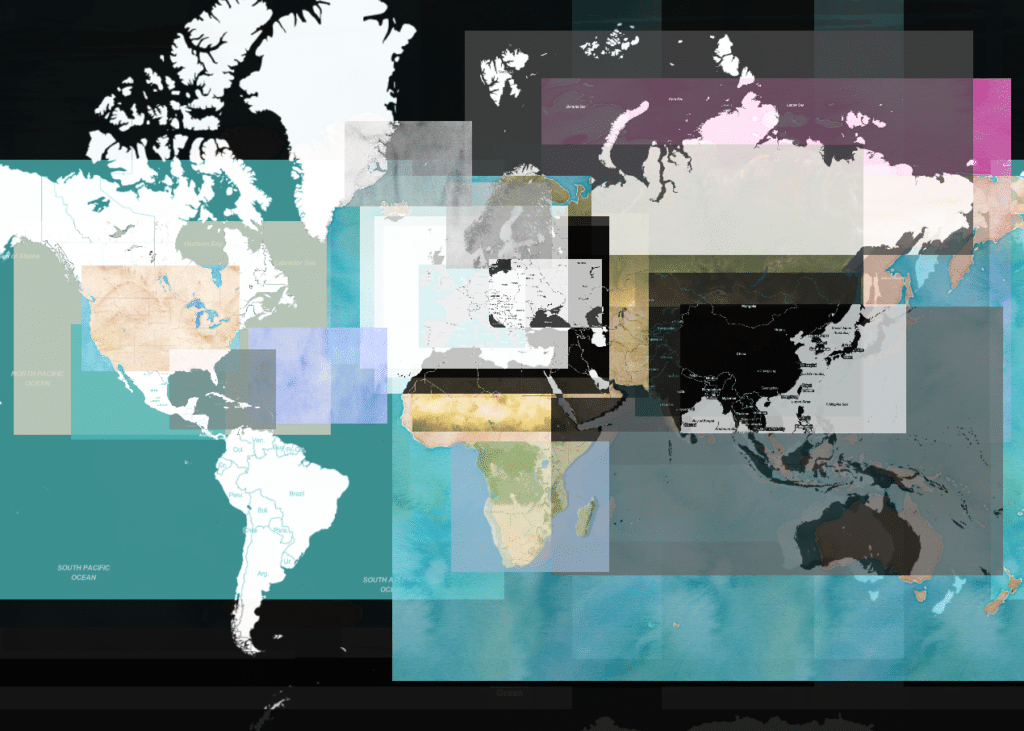
We built an interface that gives you a way to load these images for an extent on the map and stack them on top of each other, and we’re calling it Map Stack Stack:
We’ve been enjoying looking at the images at various zoom levels and seeing how people used Map Stack over the years.
You can pick an area, zoom levels, and time ranges and see what people were making maps of, resulting in a collage reminiscent of OpenWhateverMap, but more varied and as if there wasn’t a standard for scheme for positioning map tiles:
We’re also having fun looking at the places where images were taken over the years:
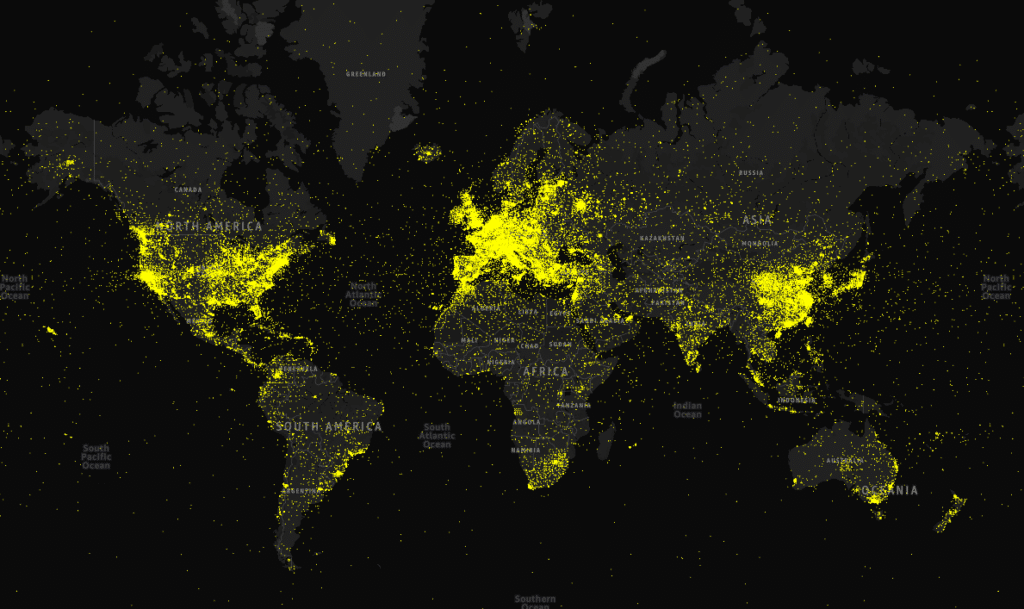
Looking at around half a million points like this we certainly see a skew toward population dense places with good internet access. Zooming in a bit and filtering the data by date and the zoom level where the images were taken, patterns begin to appear:
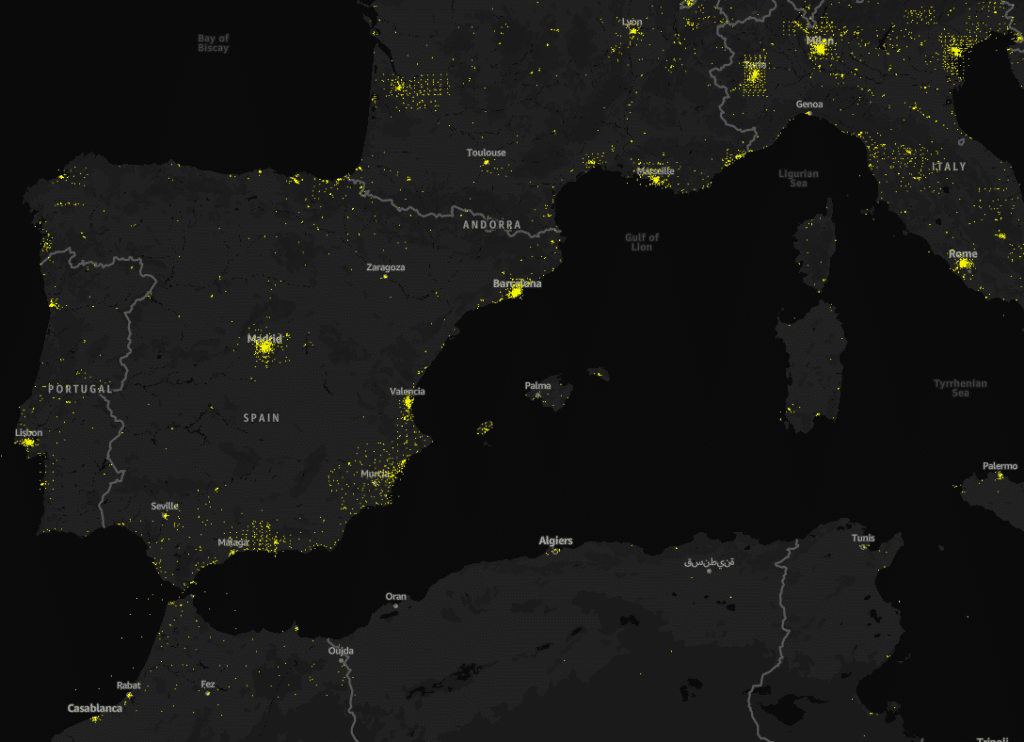
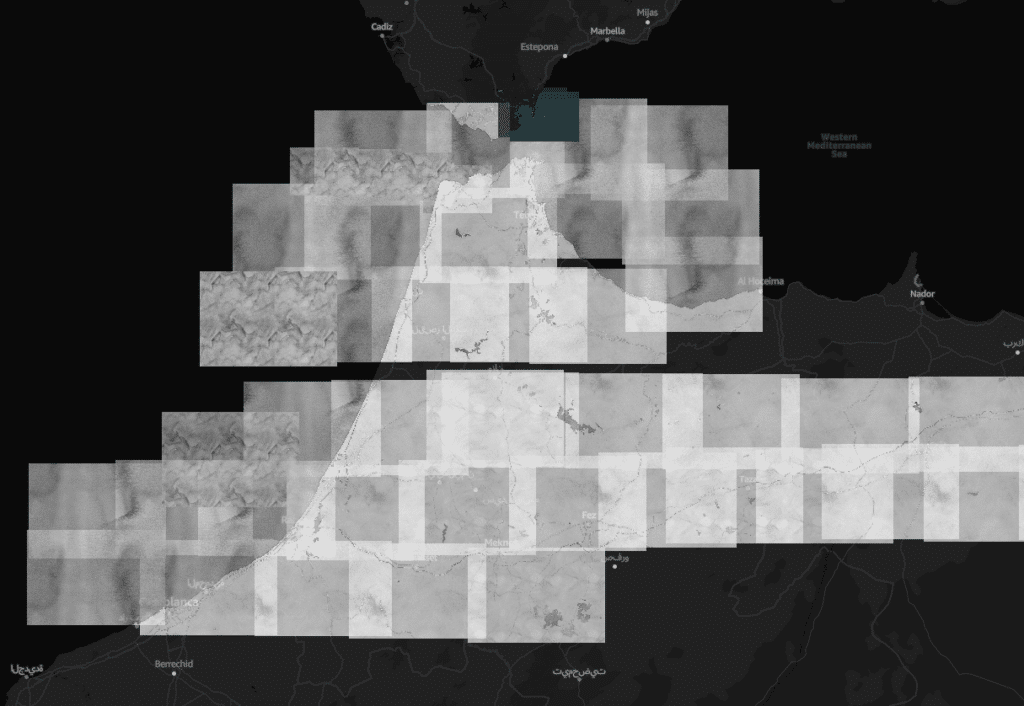
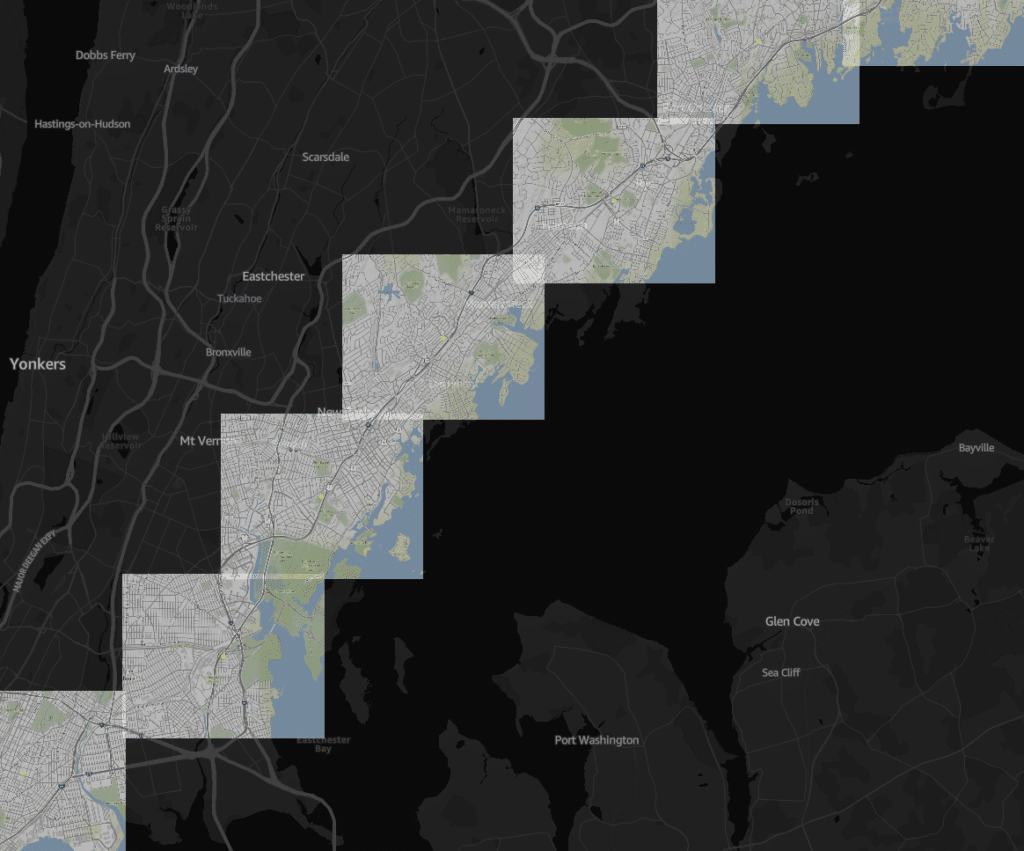
Here you can see that in some areas (such as the parts of Spain and Morocco that straddle Gibraltar) that people were likely taking a series of screenshots in shapes resembling a grid in order to stitch together higher res maps of these areas. Zooming in a bit and isolating the zoom level and time where the snapshots were taken you start to see the grid of images:
Sometimes you can also see lines form, such as this line that seems to be following I-95 from Washington DC to Boston:
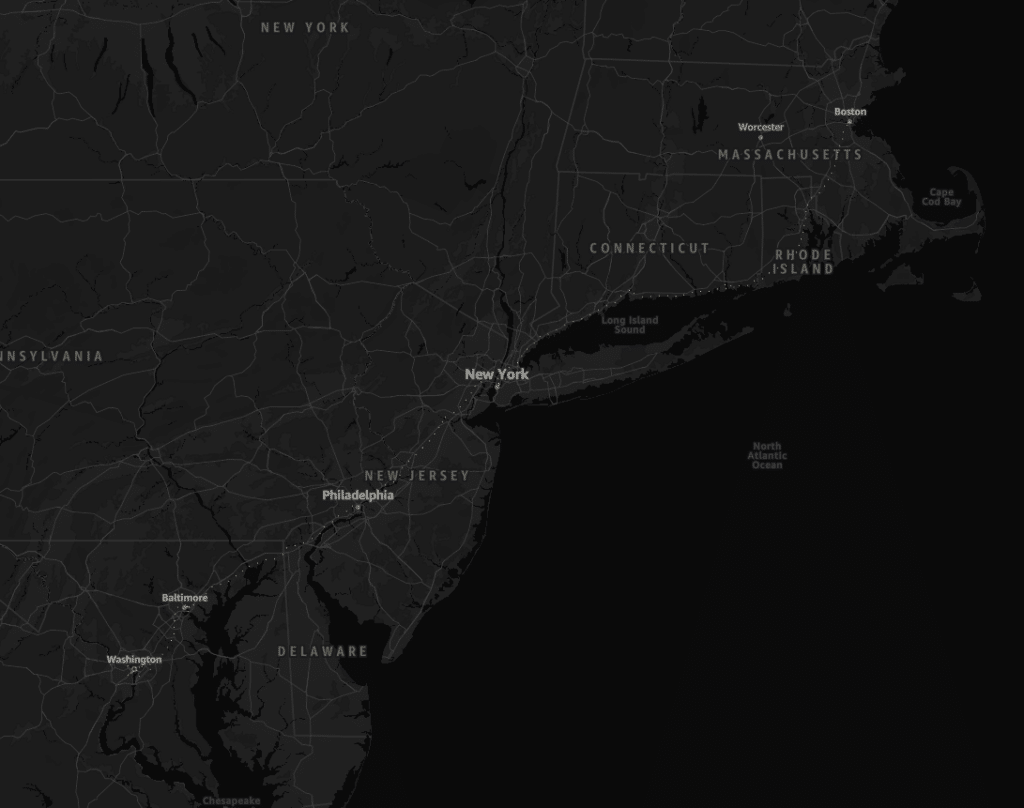
We can load those images and get a sense of this person’s process if not their intent:
We find it interesting, if not too surprising, that looking at the data by zoom level shows many center points at low zoom levels (further zoomed out) in oceans or near the middle of the map, coming into focus and mostly congregating around populated areas at higher zoom levels (more zoomed in):
While we can’t keep Map Stack running, we see this tool as a way of excavating and appreciating the creativity that Map Stack enabled over the years. Our hope is that through Map Stack Stack we can continue to appreciate what Map Stack once was.
Get in touch
Whether you have stories about how Map Stack was useful to you or you would like to talk about making your web map more resilient, we’d love to chat. Send us an email.