
As we emerge from three years of pandemic, social isolation, and political instability, how do we as humans cope with living in an uncertain world? How do we find joy and connection while acknowledging the inevitability and looming threat of climate change? In this podcast episode, Cartographer Jeffrey Linn introduces us to the concept of “Speculative Cartography”, an imaginative outlet for coping with the harsh realities we face – through fantastical and satirical creativity.
For the past ten years, Jeffrey has been creating sea level rise maps. Each of the maps in his map gallery explores how cities around the world would change should sea level rise by 66 meters, the level projected by the Intergovernmental Panel on Climate Change (IPCC) if both the ice caps melt in coming centuries.

At Stamen we’ve seen a lot of sea level rise maps – we’ve even made some ourselves – these are the “charismatic megafauna” of climate maps: like whales and polar bears, they are easier than other aspects of global warming to evocatively describe.
It’s the gentle satire and playful imagination of Jeffrey’s work that got our attention: from the name of his website, Conspiracy of Cartographers, a reference that pokes gentle fun at the climate change deniers who have trolled him on Twitter, to the irony of using old gas station maps, created by the oil companies 80 to 100 years ago to promote the age of the automobile, as the backdrop for his contributions to the sea level rise map genre.
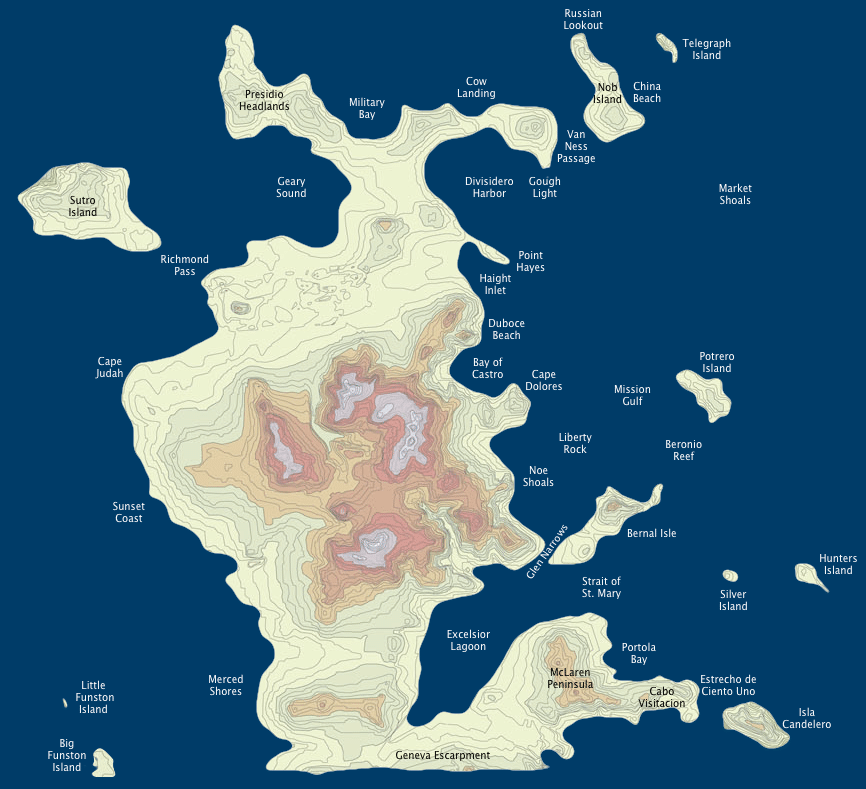
Jeffrey’s work was initially inspired by a friend of Stamen, the San Francisco blogger Burrito Justice, who created this map of the San Francisco Archipelago in 2012. Jeffrey has since produced hundreds of sea level rise maps, out of a drive he describes as “psychically necessary” to counteract the paralysis and negativity that comes from receiving the knowledge in waves that global warming is happening, and changing the world as we know it. When he started, he had been working for decades as a GIS Analyst. For Jeffrey, this work was part of a personal and professional transformation.
As we explored these maps with Jeffrey in this episode, we spoke of how empowering cartography can be for those who break out of the more autocratic and unselfconscious mapping roles to become narrators and curators of experience and aesthetics. We also spoke of the shameful legacies of power and geopolitical control that cartography carries, and how imperialism, colonialism, colonization, and slavery are inscribed in our maps, and how, for cartographers like Tanya Ruka, interviewed in our February episode, cartographers are helping communities reclaim cultural and personal sovereignty by digitally mapping native land.
Jeffrey grew up in the San Francisco Bay Area. As an undergraduate, he studied Geography at San Francisco State University, and so we knew he would be privy to a quietly ironic conspiracy that has been part of student life there for decades. To this day, there is a sign in an office window above the entrance to the building that houses the Geography department which reads:
LONG LIVE THE HISTORIC INSURGENTS OF GONDWANALAND
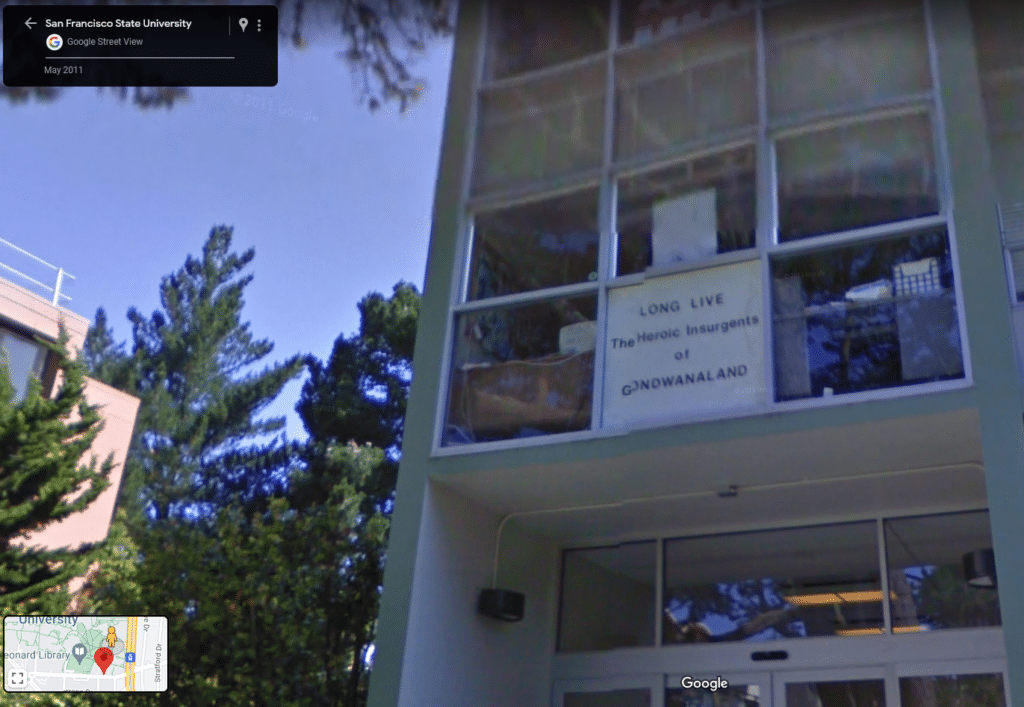
Gondwanaland is a supercontinent that existed before the first ice age of the modern era, when sea levels were high. However, Jeffrey confirmed in our interview, the origins and precise meaning of this satirical message are not apparent. Until now.
We asked the Internet, or more specifically, the alumni Facebook group, and learned this satire was almost certainly the work of the late Professor Georg Treichel, and the “insurgents” are mammals, long shots for survival on the earth 200 million years ago.
Listen to the episode and explore Jeffrey’s thoughtful cartographic ventures! Tell us what you think of “speculative cartography” what we hope you’ll find in our interview with Jeffrey is an invitation to be speculative, playful, and curious as you approach life in this uncertain world – it is possible to be inspired and inspiring, even as we worry about what the future has in store. It’s also possible to craft meaning and message from the cathartic and systematic process of placing your own labels on a map.
Also, if you’re in the Seattle area, we hope you’ll join us for Geobreakfast on Friday mornings 8:30-10 at the Lost Lake Cafe in Capitol Hill.

Transcript — +
[music]
You’re listening to Pollinate, a podcast on data, design, and the people that bring them to life. Brought to you by Stamen Design.
Stephanie May (SM): Petrofuture maps, speculative cartography, and Geobreakfast. These are a few of the things we talk about in today’s episode. I’m Stephanie May, the Director of Geospatial at Stamen. I have the opportunity to sit down with the brilliant mapmaker behind the website conspiracy of cartographers.com to talk about how he grapples with the looming threat of climate change through playful satire and imaginative cartography. Please welcome my guest.
Jeffrey Linn (JL): Jeffrey Linn and I have my studio conspiracy for cartographers where I make maps and mapping mashups sort of things. I actually really hate titles, so I tried to give myself a fun one. I call myself a speculative cartographer because the most interesting work that I do is set well into the future and it’s really along the lines of speculative fiction that’s speculative cartography. And I thought I had coined it at the time, but it turns out other people use that for themselves as well.
SM: There are other speculative cartographers in the world you’re saying.
JL: I found them sort of the fantasy mapping realm. There are a lot of folks there.
SM: And what is that thing? Can you put your finger on? You make the analogy between speculative cartography and speculative fiction? And I think that’s quite evocative. But are you able to– as you describe that there are other speculative cartographers in the fantasy maps realm? Do you have any– can you describe any more? What speculative cartography might mean?
JL: Well, for me, it’s creating more of a science fiction vibe for others it’s more of a fantasy vibe. I mean, what I try to do is I take real-world data and for my speculative cartography, I take elevation information and project like sea level rise based on what scientists have predicted would happen if all of the world’s ice caps were to melt. For me, that’s the speculative aspect of what I do.
SM: Makes a lot of sense. Yeah, we both spend some time in the San Francisco Bay Area. You more so than me. So why don’t you just talk a little bit about your background? How you ended up where you are in now?
JL: Yeah, the whole Bay Area thing. I was born in Walnut Creek, but I didn’t actually live there is about 25 miles east of San Francisco. But I didn’t live there. I lived in this tiny town called Oakley, which is way out there. And now it’s kind of the sprawling suburb used to be farms and ranches and things, and now it’s golf courses in suburbs, which is kind of heartbreaking. But I moved around a lot when I was a kid. I lived in a few places in the Bay Area, and then Lake Tahoe, Reno, Phoenix for a few years. The Coachella Valley, and then this town where my dad always lived, also east of San Francisco called Antioch. Another kind of it’s very close to Oakley, very sprawling suburb. And then when I got to be an adult, I moved to San Francisco. And I went to San Francisco state and studied Geography there and a bunch of other things. And ended up in geography. And you did too. That’s cool. It’s always nice to run into another alum from SFSU.
SM: We have San Francisco, the state university of geography in common. I did my graduate work there in the 2010 era. And one mystery that I think we’re still working on resolving that’s come up that I think we should share with the listeners is the sign in the upstairs window when above the stairwell into the HSS building into the geography department. Just in black and white sign and it says, “Long live the historic insurgents of Gondwanaland, which is deep in joke, for geographers. And you said that sign was there when you were there as well.
JL: Yeah, this was back in the early ’90s. So that sign has been perplexing generations of San Francisco State’s students. I think it was there for a long time before I was there, probably goes back into the ’80s or ’70s even. It’s been there a long time. So I was surprised when you sent me that street view link. That thing is still there. I wonder how many generations of professors have had that office and just lifted there.
SM: I email the current occupant who is the chair of the department, but he hasn’t gotten back to me. Maybe he will, by the time we broadcast this and I’ll put the– we’ll post that link to the street view on the blog, along with any answers we can get about this sign. But for those for whom Gondwanaland may not ring a bell. It’s the name for one of the proto-continents after Pangaea broke up. So it’s a deep in joke because this landform predated humans by quite a lot. We don’t know who those heroic insurgents would have been or what the origins of that joke are made of a mystery continue.
JL: Because it was a supercontinent. I guess there have been several supercontinents. I had to look this up because I knew there’s Pangaea, then there’s Gondwanaland, I think Pangaea is the more known one. I don’t know. But there have been several of them. I had to look it up, which one came first? But it was a supercontinent, and I think the old joke, the one the joke that I heard before I ever saw that sign was, “Reunite Gondwanaland.” And that’s, I think, a little more understandable if you’re aware that there were supercontinents. And one was named Gondwanaland.
SM: It does make more sense in terms of landforms and what they might do. But anyway, would you characterize that sign as a conspiracy of cartographers, or is it just a conspiracy of geographers? Or is it not a conspiracy?
JL: Oh, God. I don’t know. Conspiracy of geologic time, something along those lines, yeah.
SM: All right. So talk to me a little bit about your professional work. So you have the conspiracy of cartographers studio. You also have a day job, do the two mix at all, or are they completely separate?
JL: They’re pretty separate. I do a lot of cartography in my day job, but it’s very different. It’s a very different sort of type style of cartography. I work for King County here in Seattle, and I’ll be taking on all of the metro mapping, the best route and transportation mapping, which is fun. I was interested in transportation and still am, but I was really interested in a professionally for a while and did some course work in that a while back. There was a time when– I was a GIS analyst for a long time. And I almost left the profession I was just really burned out. I’ve been deep in projects that work kind of meaningless to me and spend a lot of time developing things that in the job that I had at the time wasn’t getting a lot of support for, and just a lot of things that were conspiring to just burn me out.
JL: And I was just sick of being a GIS analyst. And the thing that saved me from that actually, in some ways, I think I’m still burned out on that, but it was cartography and shifting my focus from the data and development aspects of geo-information to the, in my opinion, much more interesting cartographic aspects. And that gave me new life in my career, gave me a second wind. And I’ve enjoyed my career much more since I started doing that. And that was about 10 years ago when I made the first sea rise map.
SM: Oh, yeah.
JL: And I always knew that my love of geography and topography and just the physical world needed to manifest itself in some way in geography or in landscape architecture. And I think getting out of just focusing on data and development and into something much more design-oriented, something where I could use my aesthetic sense, where I could use my imagination, really sort of saved my career, probably saved my life.
SM: Thank you for sharing that. I think your experience is going to resonate with a lot of listeners who have worked as GIS analysts, have worked in the GIS field. And certainly, I can say for the cartographers that I know at Stamen the journey is pretty common. It’s interesting. I feel, in a lot of ways, many of us have reclaimed the title and notion of cartography to describe something a bit more empowered than maybe what a GIS analyst is able to do. Yes, it’s about design. But it’s also about interpretation and going beyond the tools that you’re given to have an opinion, to have a narrative, to have a voice.
JL: Yeah, absolutely. The levels of self-expression that you can really realize in that sort of work. Yeah, it is absolutely empowering to make a map with a point of view.
SM: Yeah, which is interesting when you think really about the history of cartography. Writ large, right, cartography has, at times in history, been the tool of empire. So I think there is this dialectic and this ebb and flow between mapping being something that’s done for the sake of claiming territory or at the cost of perpetuating inequality or creating inequality or creating division, consolidating power. And the other side of it, which I think, as cartographers, obviously, we want to draw out a lot more in this era, which is around reclaiming and around liberating and empowering.
JL: Yeah, there’s so much truth to that. I love old USGS maps. And one of those things that I could just spend days and days and days being distracted by. And the fact that they’re all online. And you can get them all georeferenced and everything. And I won’t say wasted. I’ve spent a lot of well-distracted hours looking at these maps. But at the same time, I think it’s important to know that these maps were tools of conquest, that these maps were made in an era when there was genocide going on in North America and the United States. And these maps were sort of tools of that. They were tools of resource extraction. They were tools of colonization and settlement. And I think that as geographers, cartographers, that it’s important to realize that’s where these came from. One of the things that is fascinating is just the number of racial slurs that you’ll find in these maps. I mean, everywhere, they’re everywhere. And yeah, and I feel like I should do something about this. I don’t know if that’s my lane as a white man. Is that something that I can really speak to? But yeah, there’s a ton of it out there.
SM: We’ll call back to our February podcast episode my colleague, Alan McConchie, interviewed Tanya Ruka of the Native Land Digital Mapping Project. And she had some really, really powerful and poetic things to say about the process of engaging indigenous communities with mapping territory, mapping space, tying history to land. Every time I think of it, it gives me tingles because it feels right. It feels like the future that we want as cartographers and as human beings.
JL: I will have to listen to that one because that’s something that really interests me.
SM: Yeah, look for the February episode. That was a really wonderful interview. Coming back to our topics at hand, so you joined me for the first inaugural Geo Breakfast in Seattle last week. What did you think? What do you think of this trend towards in-person gatherings? [laughter] Are we ready for it?
JL: That was fun. I still take a lot of precautions with COVID because it’s still out there. And so I generally mask in indoor spaces. But I don’t know. I kind of look at it in terms of harm reduction other than eliminate so I will take calculated risks here and there when I think they’re worth it. And that was definitely worth it. And I miss going out in person, going out for coffee, going out for drinks after work. I really, really miss that stuff. I started working from home exclusively three years ago. And as nice as it is to just wake up in the morning, have coffee, and not have to spend half an hour or 45 minutes getting from my house to my office. A lot is also lost in just being social and being among other people. And I definitely miss that. So I’m all excited about meeting in person. But I still want to take precautions. They have an outdoor space there, right? So as it warms up, we can move to the sidewalk space.
SM: I think we definitely should. It’s still a bit cold in Seattle, but getting sunnier all the time. And absolutely agree with everything you’re saying, both the need for ongoing precautions and the need for some calculated risks here and there as we sort of venture out. I was inspired to start this Geobreakfast here in Seattle because I was a longtime participant in the Geobreakfast in San Francisco that existed for years and years. Mike Migurski started this tradition when he was still at Stamen ahead of the State of the Map conference in Portland in 2011 or ’12. And the tradition continued every Friday at this place called the Pork Store Cafe and then in the mission. Up until the pandemic, it’s still ongoing to somewhat, but it’s also online and for me too, it very much is the right calculated risk to be taking. And we found a wonderful location in Lost Lake Cafe in Capitol Hill, which has some echoes of the diner vibe of the original Geobreakfast in San Francisco. And we’ve done two so far. It’s been really great. I hope you’ll keep coming. I’m talking a little bit about bringing in some Twin Peaks vibes maybe. They’re already some Twin Peaks vibes to that location.
JL: Yeah, it has that sort of, I don’t know, ’60s loungey diner vibe which I really, really appreciate.
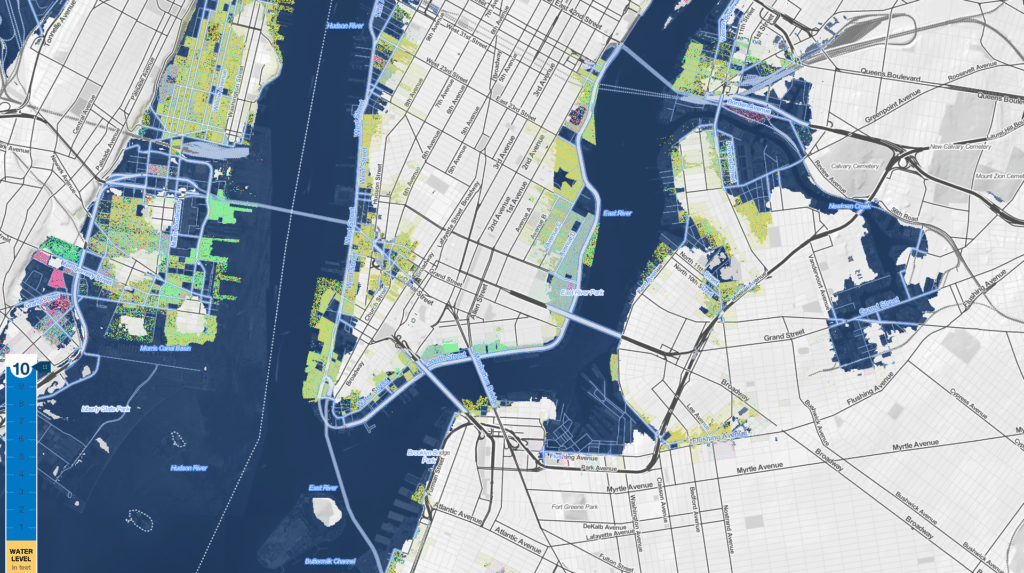
SM: So for our listeners, I have just pulled up a visual of what Jeffrey does so we can dig into it just a little bit more around speculative cartography and sea level rise. Now I’ve heard sea level rise maps described as the charismatic megafauna of future projected climate change scenario visualizations. That notwithstanding, it still is kind of a best-in-class example of how we might imagine future scenarios in the speculative realm. So I’d love to just hear you talk a little bit more about this map, this visual that I’m showing. So for those listening, I am putting between Jeffrey and I– was this the first sea level rise map you made of Seattle?
JL: Yeah. This was the first one I made almost 10 years ago. It was different, actually, I’ve revised it a few times, but it was this extent. And by the way, I love the comparison to charismatic megafauna. I’m going to use that, by the way, I hope you don’t mind. Because it is the big thing, the thing that is dramatic and gets people’s attention. There are a lot of other more subtle things that are equally, if not more damaging, that will happen with climate change. But they don’t translate as well to a map. An image like this, really, really gets people’s attention, it’s dramatic, and gets people talking. Kind of like, what is a good example of charismatic megafauna? Like a snow leopard or something that really gets people’s attention.
SM: Right, save the whales. Yep.
JL: Yeah. I mean, the thing that inspired me to do these maps originally Ursula K. Le Guin did this book back in the mid-’80s called Always Coming Home. And and it had a map in it that was the California Central Valley after all of the ice caps have melted. And that was an inspiration to me that had been just sort of moldering in my mind for years and years. And then this guy in the Bay Area in San Francisco, Burrito Justice made his map of San Francisco. And I thought, “Oh, that’s really cool. I could actually do that for Seattle.” And so I did something very similar to what he had done. And it can be a very daunting, very sort of grim topic, but I try to have fun with it. And so I give it place names, the puns, just making fun of the place, or making fun with the place with all of the names that I give the different places.
SM: Yeah, I love the fun that you had with this map and just kind of stepping back and reflecting on what you’re doing here. So you’re welcome to use the charismatic megafauna analogy. It’s not original. Credit to my colleague Damon for suggesting that one. In addition, though, I think– so you called out, okay, this map, it’s relatable. It’s attention-grabbing. It’s dramatic. That’s how it’s parallel to the charismatic megafauna idea. But in addition, I think one thing we– you and I are both in Seattle, living in Seattle right now, so there’s also that anchoring. The one thing that I noticed that everyone does when they encounter a map is they zoom in on where they live, right? So I think that’s one thing that particularly resonates for me about this work that you did and this thing that we have in common. So as I’m looking at this and zooming in on some of your names, they resonate especially. So I live on Capital Island. Do you care to name where you live?
JL: I live on Wallingford Island, just uphill from Nimby Point. That was sort of a pointed dig at a lot of my neighbors, kind of the central Nimby neighborhood here in Seattle.
SM: So if I were transported into this future scenario, I could hop on a kayak, take the Amazon River, depending on the currents, maybe take the Amazon River north to you, which is a very clever play on the South Lake Union area where all the Amazon buildings are.
JL: The actual geographic types that I use here don’t always correspond to, yeah, what the actual thing is. But it just was too much fun to pass up.
SM: Any other clever puns you want to call out in this original piece of work?
JL: Let’s see. What’s a good one? I’m fond of Lake City Bay because it plays on Lake City Way up there. Isle of Skyway, I think, might be my favorite on this one. It’s down to the south.
SM: There it is. [laughter]
JL: Yeah, I like that.
SM: I love Skyway. That’s wonderful because it makes it sound very mythical and beautiful. [laughter]
JL: Yeah, it has a certain British misty sort of vibe.
SM: Yeah, totally true to life, totally. I’m looking forward to that Isle of Skyway in some ways compared to what’s there now, but we won’t dwell. So, yeah, thanks for that exploration. So you’ve moved on a bit, and your most recent work is the Petrofuture Series. Is that correct?
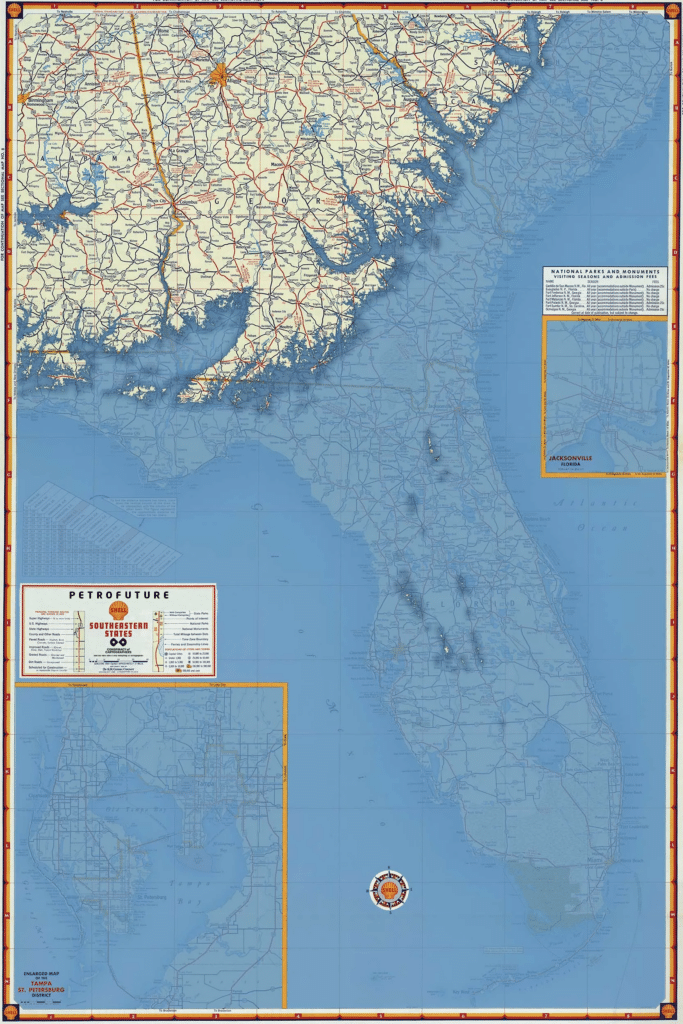
JL: Yeah. The Petrofuture, I’ve been having a lot of fun with those. So these are old gas station maps, the type that they used to give out for free when you were traveling cross countries, stop at a gas station, and pick up a map that showed you the roads of that state or city in this example. And they’re real objects, for me, anyway, of affectionate nostalgia. These are the sorts of things that when I was a kid, I used to just look over constantly. I would spend hours looking at these maps and just sort of tracing the lines and wondering, “Ooh, what does this place look like? What would this place be like if I were to visit it?” And conceptually, with these maps, I wanted to play with those feelings of nostalgia because although I have plenty of affectionate feelings of nostalgia for places and times, I do think that those sorts of feelings can get in the way of us making a better world. And so, so many people I think are really stuck in the past. And playing on that nimby name that I gave that place in Wallingford in the previous map, people want to preserve a place and time often that is their childhood or collegiate years. And what we need to be doing is looking forward and changing the world to create less fossil fuel reliance. And so that kind of brings in the whole gas station map where I wanted to play with the nostalgia and sort of poke at the corporations that are perpetuating the systems that we live in. And so that’s why I started putting the sea level rise onto these old gas station maps.
SM: Yeah. Really well said. What certainly resonates for me about your petro gas station map work is that simultaneous nostalgia feeling combined with what maps really allow us to do and process and think about both in terms of space and time. So also shifting towards the future, the way that you’re overlaying that sea level rise, that 66-meter sea level rise that the IPCC has calculated and projected if all of the ice caps melt. I think really allows for that sort of back-and-forth exploration in a map piece, which is really incredible. So for folks who want to explore these maps more, Jeffrey’s done a huge series of them for all sorts of cities. They’re on his website, conspiracyofcartographers.com, both the sea level rise series and the Petrofuture series, and anything else on there that you would want to highlight Jeffrey that folks might enjoy poking at a bit more.
JL: The retro-future, I had a lot of fun with as well. Mixing up the past with these projections well into the future is just– it’s a lot of fun to do. And I’ve always loved old maps, like so many geographers and cartographers. It’s really satisfying to work with these old vintage maps. I do a lot of work with those in the United States. The Petrofuture maps, I have to credit the Rumsey map center for providing the base maps for those. They actually bought a couple of the California Petrofuture maps to put in their collection. That was gratifying. That was really a good feeling to have him do that. But yeah, and just sort of random cartographic things are also on there that I’ve done.
SM: Just to tie it back into the speculative cartography theme. The last thing that I really love about it is that I think is very timely to this moment is that like speculative fiction, I think speculative cartography gives us this opportunity to process what’s happening. As we’re starting to really feel– I feel like in the last couple of years– the world changing around us. There’s something sort of psychically necessary about starting to envision both the future in the past and placing ourselves in it. I’ve found myself reading a lot of near-term speculative science fiction in the last few years, just to try and grapple with what the future might look like. And so I think that your speculative cartography fits really well in that tradition. And I love that about it. And thank you for it.
JL: You mentioned the sort of psychic necessity of seeing where we were as climate change is becoming more and more obvious. That was something– all of these maps, I think, are really an expression of me kind of working through my own climate change feelings and it’s been really therapeutic for me to be working on these projects. I kind of feel like it’s been crucial to my life for the past 5, 10 years, to work on these things. Just a real good way for me to sort of work out my climate change anxieties. But do you have any recommendations for near-term speculative fiction? I’m always looking for good recommendations.
SM: Well, the classic for me is Octavia Butler, Parable of the Sower, that series, I think, is quite prescient in a lot of ways. I think there’s more in this genre, certainly, to be written as well, because there’s plenty of space travel science fiction, and plenty more to say about how the earth might change in our lifetimes and beyond and what humanity might look like. Thank you for diving right in there and exploring a bit of your work with me. In any case, it’s wonderful talking to you this afternoon. Thanks so much for making time. As we close out, I’ll ask you one more question, which is, any ideas you’re thinking of? Any ideas you’re pondering for future work that you want to share?
JL: Oh, God. I keep a running list of ideas that I may or may not get to. I’m still working my way through some of the Petrofuture maps. I’m working on a series, which I’ve kind of thrown a few out there, silhouette maps. I’m not sure if that’s the term, but it’s basically two or three colors. Water is one color, land is another color, and then I have streets as a gray. And so they’re black and white and gray of sea level rise for various cities. And I was interested in doing a series of maps that have nothing to do with climate change, but I’m interested in maybe doing a series on sacred sites, especially sort of North American native sacred sites. I think that would– that’s the latest thing I’ve added to my idea list that I can get inspired with. And I mentioned my love of the old USGS quads. I’ve been working on a map that takes those late 1800s, early 1900s, map styles and updates them with newer techniques, newer information that in the same sort of aesthetic spirit as those old USGS maps. That actually feeds into this sort of personal archeology project where I’m looking at the different places from my childhood, which was mostly– which was all spent in the American West and mapping those memories out as USGS-style map quads. And I actually have been working on this one thing for the past week that does that style of, created the style in this area north of Pyramid Lake in Nevada. And so the basin and range geographic patterns are so fascinating to me because you get these just rugged jagged peaks and then these flats U-shaped valleys and in sequence across and they’re all like north to south. And I just love looking at those patterns. And there are so many remnants there, mining camps and things like that, that we used to explore when I was a kid. A lot of these are personal projects, like this whole personal archeology thing.
SM: That sounds amazing. Have you ever read John McPhee, Basin and Range?
JL: Gosh, I’ve had that on my shelf for years, and I think I cracked it a couple of times, but I never actually read it. But just the title.
SM: [laughter] Absolutely.
JL: But yeah, the whole great basin geography is fascinating to me, especially having spent a lot of my childhood there.
SM: Right. It absolutely is. The way it’s kind of writ large. Like a lot of landscapes in the west, they’re just so huge. They’re so vast that they’re hard to take in.
JL: Yeah, you see them on a map. And it’s like, oh, well, that’s interesting. There’s a mountain ranges and valley. And once you’re in it, it’s vast and monotonous, but the monotony is really interesting. It’s a really interesting monotony. If you take Highway 50, you can drive from Lake Tahoe, and then you go immediately down into the basin, and you just go like that for hundreds of miles. And they call it the loneliest highway. And I know why they call it that. I’ve been there. And it’s just amazing.
SM: Yeah, it is. And right. And if you have that cartographer sense of what happens when you pan out and you see this just incredible landform. And then if you know the geologic history behind it, how that basin and range land formation forms as the plates are pulling apart and just the intrigue increases.
JL: And the fact that it was this massive Lake, just Lake Long, the ice age Lake, when there was a mile of ice where we’re both sitting, there was a massive Lake. And to think about it in geological times, there were humans. There were humans walking around and paddling around in Lake Lahontan, getting around the glaciers of the north.
SM: I wonder if they were speculating about our future, about the future we’re in right now, those humans.
JL: That would be interesting. Yeah, what were their thought processes? And things changed more slowly then for humans. Now, we’re just in this era of constant change and we have adjusted, I guess, psychologically to that sort of thing. But what would it be like to live in a society where things didn’t change? Or they changed very slowly over the course of generations. That would be interesting. Sometimes I have a nostalgia for that sort of thing, which I never experienced.
SM: Absolutely. Yeah. Very resonant. All right, well, wonderful. Thank you so much for sharing all of your thoughts and really looking forward to the continued development of your work. And I hope to see you at Geobreakfast some coming Fridays and to just continue the conversation. Thank you so much, Jeffrey.
JL: Thank you so much, Stephanie, and I will see you for the next Geobreakfast.
SM: Thank you for listening to Pollinate, and thanks, Jeffrey for joining us today. This episode of Pollinate was written by Alan McConchie, Damon Burgett, Ross Thorn, and me, Stephanie May. Music for Pollinate was created by Julian Russell. You can find Jeffrey’s work including the Retro and Petrofuture maps on his website, conspiracyofcartographers.com. If you’re a fan of Pollinate and the content we put out, please review and subscribe to the show wherever you get your podcasts. More importantly, share the show with your friends and colleagues. If you enjoyed today’s episode, tell us on Twitter @stamen or on our Mastodon account at viz.social/@stamen. And tag us using #pollinate or #PLN8. Remember to keep an eye out for the accompanying blog post at stamen.com/blog where we’ll provide visuals and follow up with updates on the themes and topics Jeffrey and I discussed and provide you with links in a transcript.