
The field of data visualization and information mapping has historical roots that date back far earlier than most people would imagine. Micronesian explorers created navigation charts with sticks and shells for thousands of years before the introduction of electronic navigation technology. Hundreds of years ago, humans had the means to mechanically collect data on everything from the pulse of ocean tides to the pulse of a living heartbeat. Data storyteller RJ Andrews is on a mission to showcase the work of the visionaries who carved the path for those of us working in the field of cartography and information design, and through his latest book series, “Information Graphic Visionaries” he has accomplished this mission with astounding success.
In this episode, we learn how RJ’s interest in history and information design sprouted its roots, and go into depth on two of the three inaugural books in the series. We nerd out about the vast contributions and influence of EJ Marey and Florence Nightingale, and examine some of the harmful realities of the forces and ideologies in place that enabled their work (i.e. colonial empire building and Christian purity culture). It was fascinating to explore the different ways in which both Eric and RJ encountered the work of Marey in their data visualization journeys and how each became deeply inspired.

unbekannt; uploader: Eberhard J. Wormer, Public domain, via Wikimedia Commons
Beyond their rich content, which includes modern analysis of each visionary’s contribution and stunning quality facsimile reproductions of their work, these books are a work of art themselves. The quality of materials, thoughtful design, and uncompromising detail (foldouts, inserts, half jackets, debossing, foil stamping, oh my!) are a manifestation of the manner of respect in which RJ believes we should treat these works. As he put it, “It’s time to actually push this a little bit further…why doesn’t the field of information graphics, maps, charts, diagrams treat our field with the same respect that the art world does and same respect that the world of science does.”
Copyright Visionary Press 2022
We’d love to see more books in the series, and we can help make that happen by ordering a set from visionarypress.com! Which of these iconic visionaries is your favorite? Do you recognize any of their work? Let us know on Twitter!
Transcript — +
[music] You’re listening to PLN8, a podcast on data, design, and the people that bring them to life. Brought to you by Stamen Design.
Catherine Madden (CM): Treating information graphics with the same respect as art and science. Staying tethered to reality when working with data and statistics and how spending time with the work of people who have long since passed can make you a better information designer. These are just a few of the topics that came up in today’s episode. I’m Catherine Madden, data storyteller and friend of Stamen.
Eric Rodenbeck (ER): I’m Eric Rodenbeck, founding partner at Stamen. Today, Catherine and I talk with the editor behind the new Information Graphic Visionaries series. This fascinating collection of books explores the historical roots of modern data visualization through the lives of some of the people who invented it hundreds of years ago. Please welcome our guest.
RJ Andrews (RJ): My name is RJ Andrews and I am a data storyteller.
CM: Welcome, RJ. It’s so nice to be here with you and Eric.
ER: Welcome, RJ.
CM: I would love to walk through this project that you have recently put out into the world. So can we talk about that just quickly as an intro? And then, I would love to get to share more about who you are with the listeners of the podcast.
RJ: Information Graphic Visionaries is a new book series we are launching with an inaugural three volumes. Each volume is about a historic person, a historic visionary who did bat chic crazy things with data graphics. And so each volume has a little bit of its own personality, but they all feature really stunning, beautiful, inspiring, spectacular graphics that are just going to amaze and delight you. And they also feature the stories behind those graphics.
CM: Oh, man. They’re such amazing books. I feel lucky to have all of the current volumes right here by me. And I will add you as someone who’s done something bat chic crazy to the list of people that you’ve featured because when you open the box with the books in them, it is just astounding, the level of detail and thought and craft that you have expertly put into the creation of these books. So they’re amazing and we’re going to get more into them. But like I said, I want to go way back to the beginning because you and I are friends. And I was preparing for this episode and remembered a really fun fact that I want to see how this has informed this project that you’ve endeavored to complete today, which is the fact that you and your family were active in Revolutionary War historical reenactments in New England, is that right?
RJ: Yeah, that’s correct. So both of my parents are history nuts, and I grew up all vacations were going up and down the Eastern Seaboard, traveling to historic sites, living in museums, but particularly doing this, even at a time we were very self aware, like this is a very funny hobby. You get dressed up in funny clothes and you go to a historic site or a nature park and you pretend that you’re living 200 years ago. And there’s battles and there’s historic cooking and there’s historic music. And so this was an incredible experience to be part of a community of people who are interested in a historic time period. Everybody who comes to these events comes sort of like for their own reasons, like some people are really into shooting muskets. Some people are really into period folk music. And so everybody has their passion that they bring to it and they’re excitement and enthusiasm. How does this relate to data? I think that it was a total experience maybe as close as you can get or somewhat close to living in another time. And so it made this other time period feel very much alive and it felt like it was closer, and it made you feel some connection to the people who actually lived back then because you were wearing clothes made of the same material that they lived at. It was a real experience. And at the same time, it sort of made parts of your own life seem sort of dull or at least different, if not dull. And to me, my interpretations, when people think of history, they think of a black and white or a CP photograph and a lot of dust, and it wasn’t that at all. It was very much alive, and it was people living with somewhat different contexts and constraints, and appearances were different. But there are also things about their experience – which, honestly, which we’ve lost – and things that are really delightful. And what’s really interesting is people who are living historically were a little bit, I think, better tuned to sort of– maybe this is maybe too philosophical, but some sort of natural state because they didn’t have this digital layer on top of their reality that we are now, quite honestly, consumed by. And so you can see it, how they lived, what attracted their attention, what was interesting, what excited them, what was joyful about their experience and their existence. And you can long for that, or you can say, “How do we recreate that and bring that back into our world today?”
CM: Oh, man, that’s so cool.
RJ: One example of that is that, how do I consume music right now? I consume music by myself on headphones. Almost all the music I consume is like that. It is a solitary, almost asocial experience because I’m going to be walking outside and somebody’s not going to talk to me because I have my headphones in, right? How did people experience music back then? And when you go reenacting, this is how you experience musical. It’s a communal activity. Like folk music is something that everybody participates in. And I like listening to electronic music on my headphones, that’s one experience. I like going to a giant arena concert and seeing some famous performer, that’s another experience. But it’s a totally different experience to be in a candlelit space surrounded with people singing a song that’s existed for hundreds of years and everybody kind of adding their own little maybe timbre to it. It’s a very rich experience and I find the analog world and particularly analog information graphics, particularly analog maps, to be incredibly rich. And it’s something that I’ve been a bit obsessed by for many years now, and it’s a area that’s sucked me in, and I don’t think it’s going to release its grasp anytime soon.
CM: Good. I was going to say, I’m so glad that you have this experience in early age, getting familiar with what it’s like to immerse yourself in something historical because you feel that when you hold these books, and. I just thought of you as a collaborator, as a modern day contemporary but back in time of all of these visionaries that you studied and put together their life’s work for us. So it’s so felt, and it’s like the way that you described it, now it makes so much sense. I have one follow-up question, you mentioned people having fascinations that like musket shooting or whatever, did you ever end up with an activity of sorts that you did in the reenactments?
RJ: I started playing the field drum, I think, in maybe 1st or 2nd grade. And so I did that from age, what, 7 or 8 years old, all the way up till 16. And so 16, you’re allowed to carry a musket? I did that a little bit, but I kept drumming throughout. In high school, I was a music nerd, big time. And so that was a great on ramp from age six, seven years old, playing the drum going all the way through. So the folk music is particularly important to me. I grew up both with Irish and English folk music in my house and in reenacting. And so that’s something I quite miss actually, especially since the pandemic, participatory sort of folk music.
CM: So you did this through your teen years. And we’re just going to jump ahead now to the higher education journey that you went on. Correct me if I’m wrong, a BS in Ms, in mechanical engineering, specialty in thermo fluids from Northeastern, is that right?
RJ: That is correct
CM: yeah. And then you worked in that field for a little while before getting an MBA. Is that right?
RJ: Yeah. So my dad’s an architect, and I kind of wanted to be an architect too. And my dad took me aside. He’s like, “Look, we don’t live at a time in history when people appreciate buildings, especially in America. We just don’t build nice buildings anymore. We build buildings that are supposed to last for the life of their mortgage, and that’s it.” And so a lot of people come to information graphics from architecture, partially because architecture just isn’t as much fun as they wish it could be, but also because they have the right skill set. Architecture is this beautiful blend of technical skills. You can do math, but you can also draw, right? That’s really important. And so my dad’s an architect. That’s kind of what I grew up with. I thought I’d be an architect too, maybe. I applied to architecture and engineering programs, and I thought, you know what, being an engineer is going to be a little bit more useful. And I think that was the right decision.
RJ: But coming out of my first wave of education, started working as an engineer, and what I realized is none of the problems are really technical problems. All the problems are people problems. And in particular, as an engineer, people will give you specs, and you have to go work against those specs, and that’s how you solve problems. But what was interesting to me and what got me most excited was when I could actually talk to the people with the problems and help them actually identify and maybe write those specs. So I don’t really understand people at all. I was an enormous introvert. I spent an entire year in grad school in a lab with no windows and pretty much lost the ability to talk to anybody. And so I was like, I need to figure out people and how to work with people. And so I went to MBA school to do that. And so I pretended to be an extrovert. I sort of became kind of like a default social chair for my class, or at least one of the big social nodes in the class. And that taught me everything about how to walk into a space and command a room when you need to, that kind of stuff.
CM: I mean, I see you as a connector as well. And you got a little nod in the episode with Shirley because you were the person who introduced me to her, and you’ve played a role like that in my life. So how long after you graduated from MIT with your MBA did you start Info We Trust, the website and this data storytelling practice?
RJ: I registered the domain, I think, three or four months after graduation. But I had already started making information graphics for money while I was at MIT. And it was while I was at MIT, I took a class at the Media Lab with Sandy Pentland Yosponson, and it was about new media ventures. And that was the class– because I’m trained as a mechanical engineer. It’s the world of atoms. And so that was a class, I was like, okay, I have to get serious and realize the Internet is everything now, and you have to figure out some way to work in the world of bits. And so my way into that was information design. In particular, I gave a slide presentation in the MIT Faculty Club to a couple of hundred people, and it didn’t register with anybody. I was like, this is the best thing ever. Come join me. We’re going to go do it. Nobody cared. But I cared. And the presentation was all about, it was a rant against how information was organized on the Internet, because everything is in lists. Everything is in lists. Google search results, information in Wikipedia, everything is a list. Humans don’t like lists. What we like is maps. We want maps. We want context. We want to explore. That’s how humans consume information. And so that was my packaged rant that I delivered circa early 2012, about a decade ago. That got me going, and that’s when I sort of committed to the world of information graphics.
CM: Did you just freelance from that moment forward? How was your actual life funded for the first few years?
RJ: Yeah. How do you make money? So I sort of freelanced. I worked as a contractor for Duke Medicine for a couple of years while my wife was finishing her residency at Duke Medicine. And that was really fantastic for a number of reasons. Particularly, it exposed me to a broad set of information there was a group of people at Duke University, both inside Duke Medicine at the university at large, who appreciated what I was interested in and found ways for me to essentially practice. And so from Duke, we decided to move to San Francisco. And I expected to come to San Francisco, and if I was really lucky, I’d go work for a big tech company or something thing and afford to live in San Francisco. On my way out, I had a couple pieces that got attention on the internet, and this was back in 2015, which is, I think, the tail end of you could create something independently on a blog or something, and it would still travel to places. But I got some attention from some pieces from work I was doing and just putting out for fun and that led to jobs. And I honestly got tricked. I got tricked into thinking that getting freelance jobs would be easy, that it would just flow in, but it was a good enough trick to keep me from going and working at a real place. And so that’s been the story kind of ever since is trying to figure it out and honestly trying to stay alive as an independent creative, somebody who chooses the project they work on, somebody who wants to write either blogging or writing books, somebody who’s fiercely independent, somebody who’s fiercely aware of how short life is, how limited our time is, and how you want to be– not only enjoying, but putting that time to whatever purpose you think is worthwhile.
ER: I just want to step in, if you don’t mind, and just recap that. We’ve got failed architect, check, historical roots of data visualization, check, and medicine and physiology as a rich source of information problems. Those are all fun and good.
CM: Yeah. And I was also going to see, Eric, if this journey to becoming a data storyteller resonates with you particularly living through the era of having a website and independently publishing things that fascinate you and by the fact that that resonates and goes viral with an audience online, brings you more work. I feel like there’s a parallel journey that you share in some ways with Stamen, but– yeah. Does it resonate? Where is it the same or different for you?
ER: Very similar. I think RJ just has a lot more cred than I do in terms of academic. I mean, I got kicked out of architecture school. Your dad wisely guided you away from it. My dad didn’t. He’s like, “You should go there because it’s free and you can live in the basement.” And I was like, “Okay.” And then it just– anyway, it was the ’80s and they were all quoting Walter Benjamin and I couldn’t figure it out, but for sure. And I love this notion of architecture as training for data visualization and mapping. I’ve always been drawn to people who, as you say, can do math and draw, and those two things together combined with the kind of mechanical reproducibility of all that stuff is certainly what’s fascinated me for my whole career. So it’s nice to see. And we’ve also had very many failed architects come through Stamen and we sort of talked about it as a kind of haven for people who are never going to finish their Ph.D. but are really curious about math and art and want to draw. So it resonates very strongly with me.
CM: Yeah, it’s like that left brain, right brain combo that I think all of us share that makes it– except I’m not actually very mathematical.
ER: Yeah, me neither. I’m looking for shortcuts.
CM: Struggled through all of my advanced math courses.
ER: Same.
CM: But there is this sort of logic brain with the creative brain combo that is I think a huge asset. I’m thinking about sort of following the linear journey. We’re still not at information graphic visionary series because was before you did that you wrote an astoundingly awesome book, Info We Trust: How to Inspire the World with Data. I remember vividly. We went out for a beer. I think you’ve maybe submitted your final manuscript and you really did it looked like you had been alone in a room for like two full years. But this is an amazing book. What did you learn from the process of making this book, and what made you want to have another go at publishing something?
RJ: I think I learned that I really like making books. And making books is– I think making books is the hardest thing I’ve ever created. It’s way harder than an interactive contraption for the internet. And the reason is because it’s a linear journey. Okay. So here’s what a book is: a book is a multidimensional model of something, of reality, right, a piece of reality. It’s not three-dimensional. It’s actually multidimensional. But the book is a one-dimensional path through that multidimensional model because each letter follows another and each word follows another. And so it’s a one-dimensional route through this idea space. And so the author has this idea space that they want to convey to their reader. And the only way they can draw you a picture of it is in this one-dimensional way. And the thing is that when you’re writing a book, you don’t have a good sense of the idea space. You only discover the idea space by actually writing the book. And so that is extraordinarily intellectually challenging to write. If anybody says writing is easy, they’re lying to you. The most successful writers– writing is still hard. And then you layer onto that book design, right? And book design itself, which is where do you put the image? And that aspect is just insanely joyful. There’s nothing more satisfying than knowing that you have a idea for an image, and it should be about this big. And then you go execute the image, and then you snap it into your InDesign file and everything just, like LEGO bricks, clicks into place. I don’t know any better creatively satisfying feeling than that.
CM: I can relate having worked in print layout for the first few years of my design career and watching it all come together and also just the technology available to do some things like popping in a text and then having it laid out over 70 pages with inset imagery and stuff like that. It’s pretty great. Okay. So I want you to read a quick quote from Info We Trust to lead us into the Infographic Visionaries book series. And it starts on page 14. So if you can read the first paragraph, the bottom of page 14 and the top of page 15–
RJ: My pleasure. “A curious world. When we create a statistical chart, we intuit that there is something magical about arranging data into forms that can be seen. But this notion is incomplete. It misses that data originates in the physical world. A song recording did not materialize from the ether. The song was once sung by a real person in a real room. Likewise, our craft does not just make the invisible seen. It makes a past reality real again. Better data stories result when we recognize the material origins of data. Better data stories result when we appreciate how our mind interacts with the physical environment. When we acknowledge the life that produced data, the real life we see and feel, then we can better comprehend the abstract ecosystems of mathematics, statistics, and data.”
CM: When I heard that or reread it– because I went back, and I just opened the book and I had underlined and exclamation pointed, particularly, “When we acknowledge the life that produced the data, the real life we see and feel.” It just feels like another consistent thread. That’s something you’ve held on to for many years. But I’m curious, reading that now, having gone through an exercise of creating these new books, does it have any new meaning, or what’s it like to go back and read those words you wrote years ago?
RJ: I think two things come to mind. So, from one point, like an academic perspective, I was really into embodied cognition. I am really into embodied cognition. The idea that we understand the world through a chain of metaphors and all of those metaphors originate in our experiential physical interaction with reality. And I totally agree with that still. But you say something like, embodied cognition, and it sounds a little stuffy. Okay. So that’s one piece. I’m still on board with embodied cognition. The second piece is that practically, this is something that I still do in my consulting practice. And any project I do is, if I have a healthcare data set, ideally I am going and actually experiencing a small sliver of the reality that produced that data set. I had an experience with a foundation client recently, and they’re explaining everything they do in these abstract terms, but they have an actual site. It’s the pandemic. I’m not there, but could you do a Zoom tour for me of your entire space? I just want to see where are you. That was really important to me to see that, and they thought that was really delightful, and so that’s what we did. And we spent 45 minutes actually going around and me asking questions like, “What’s that picture over there?” And just having some sort of physical sense of, where is this stuff actually rooted in reality, I believe is very powerful because– and this is a problem I had you mentioned when I wrote Info We Trust. You saw me, and I felt I was disconnected from physical reality. And I was, I was lost in the world of words, and that’s a big problem. It’s a social problem we have, is that we’re becoming untethered from physical reality. And so if you have some linkage to physical reality when you’re working on a project, then I believe the project can ring a little bit more true.
CM: With that, I’m imagining the physical reality, another chapter, another hangout. Catherine and RJ going to get coffee in the Mission. And we walked down to Heath Ceramics Newsstand, and we’re picking up books, admiring their spine treatment, or how a series is beautifully composed together. I’m moving into the inspiration. We talked a lot about sort of the love for historical immersion, your fascination with bringing and learning from people who have produced amazing work into your practice. But I think there’s also this fascination with craft and the beauty. Beyond those things, is there anything else that fed your creative spirit or inspired you in the early stages of making this visionary series?
RJ: There’s two big buckets, right? There’s things that you’re pissed off about that you want to fix, and then there’s things that you want to aspire to. And so in terms of things that you want to aspire to, maybe this is a critique, but I recognize that the information graphics book situation, as an industry, was somewhat mature and was ready for the next step. And when I say it was somewhat mature, I mean that there is dozens, maybe even a hundred, maybe hundreds. If you go back across the last century of here’s how to make a bar chart type books, everybody kind of writes their how to make a bar chart book. I certainly did. And so there’s lots of that. And then there’s also a bunch of pretty coffee table books. And the pretty coffee table books have three to eight sentences maybe about a graphic, and the graphic is produced so that you can see what it is, but can you really experience it like it was meant to? Maybe not. And so I was it’s time to actually push this a little bit further and do what the art world already does, which is create monographs and do what the science and mathematics world already does, which is how many books are there about how Einstein discovered whatever? A lot. right? And so why don’t we have that? Why doesn’t the field of information graphics, maps, charts, diagrams? Why don’t we treat our field and our craft with the same respect that the art world does, with the same respect that the world of science does? That was a point of, I guess, a little bit being kind of energized, a little bit sort of aspirational that if we really want to share the thrill we have with this field, we have to start respecting it and treating it as we believe it needs. And so that was a big piece of it. Practically, what was I looking at? Books just on the American Revolution, and it includes this series of books put out by the New York Times for the bicentennial late 60s, early 70s called Eyewitness Accounts of the American Revolution. And all it was is well-produced facsimiles of original journals of people who served in the American Revolution in various armies. I mean, my dad had the whole set, hundreds of books, right? And they’re gorgeous. There’s this idea of like, “Oh, there’s all this content out there that is phenomenal, and it’s all out of copy, right? But people aren’t enjoying it because it’s not packaged well.
RJ: Okay. So that’s kind of like a node. A second node closer to data graphics is Howard Wainer. So Howard Wainer and I did a project together, and he sort of becomes a mentor. And he’s an absolute legend. Howard also wrote books, and in particular, he wrote two books that were really influential to the series. One is that with Ian Spence, he republished William Playfair’s work and has foldouts. And it’s just the neatest little volume. And if you look at his volume on William Playfair, you’ll see quite a lot of inspiration for Info We Trust. And there’s a lot in Howard’s William Playfair volume that directly inspired the Visionary series. But he also did another thing. He worked with Jack Bertin. And Howard is the one who figures out how to translate semiology of graphics. Now semiology of graphics is an important reference book for our field, if not for the current generation, at least, half a generation ago. That is when data hits maps in a very modern way. And we all love that book, and we love Bertin. But Howard is the one who brought that to America because he’s the one who worked to get it translated from French to English. And he did that way back. I think the translation comes out like 1980 or something. And so that’s been around for a while, but it’s been very, very influential. And so having these two books that– again, Howard is sort of conducting the orchestra here. Howard’s name is not on the cover of these books, right? It’s William Playfair and Bertin’s on the cover. But Howard is actually sort of the elemental force who’s bringing this work to everybody’s attention. Not creating the work, working as the producer or the editor. And so that is also very instructive to me that there’s a lot of value in packaging this content in a way that it can really soar.
CM: Wow. I asked you a simple question. You did this on a whole journey. Eric, I saw you light up at a couple of points. Is there stuff you want to follow up on?
ER: I’m lighting up all over the place. It’s so good. I mean, just the notion that the field is mature enough that it can recognize its actual roots and to sort of develop a common understanding of that. That data visualization wasn’t invented in the ’70s. That people have been making maps for a really, really long time, and that people have been using what we would describe as technology to make data visualizations for a long time, at the very least since the 1840s. I would so much rather trace the roots of our fields to the 1840s than the 1970s because there’s a lot has happened.
RJ: Yeah. I mean, fun trivia is that we’ve had mechanical contraptions making automated plots since the 17th century– since the 1600s, looking at things like the rise and fall of the tides. You attach a float to a pencil and put some water and attach that to some gear– some flowing water, you attach it to some gears, and you move a scroll of paper. And I’m not saying you could do this. I’m saying they did do this. This is hundreds and hundreds of years we’ve been creating not charts, I mean, machine-generated automatically charts. This is a very, very old field. It’s not an ancient field, but it is old.
ER: Well, then you start to get into things like the way that the Polynesian navigators used to construct these. I don’t know if you would call it a machine in the sense that it doesn’t have gears, but it’s definitely a machine for learning about where the stars are, and [crosstalk] sit inside it. Yeah. And it’s a real and it’s a precise tool, and it’s used to do real things. And it’s used to move people across just vast areas. So I tie what we’re doing very much to kind of tool making and map making more than I do to computer programming. And it sounds like you do, too, that’s why I’m lighting up. Catherine, this is just like I’ve been a fan of this work for a very, very long time, and I’m just really psyched to see it being presented in the kind of super legit, and also really well-designed way that you’re doing it. It’s kind of my favorite thing about it. It’s not just a textbook. It treats the way the material looks with the respect that it deserves.
RJ: That’s exactly right.
CM: I’ll just keep going back to this quote, “Better data stories result when we recognize the material origins of data.” You really manifested that in these books.
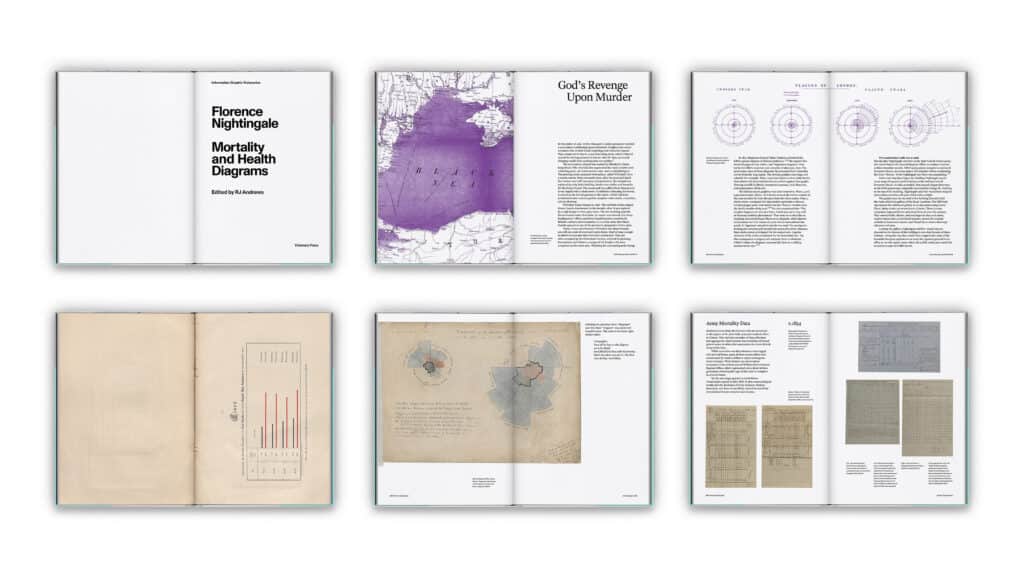
RJ: Jumping ahead. Nightingale, who is one of the visionaries in one of the volumes, she was nicknamed the Passionate Statistician by her first official biographer. And the reason she was called a Passionate Statistician is because she could look at a table of numbers, dry statistics, and she would see the suffering of the individual patient. And that always motivated her through absolutely merciless hours on end, 20 hours days, crunching data, writing letters, alone in a room type work. She never lost the experience that she had actually witnessing the suffering and horrors of the patients.
CM: So, yeah, you touched on Nightingale. The other two visionaries are Emma Willard and EJ Marey. So why were these three the three that you started with? Because I know that there’s perhaps a vision for expanding beyond that three.
RJ: There’s dozens of possibilities. And the original plan was actually to start with a single volume, and that volume was going to be Nightingale. And then pandemic stuff happened, and everything got delayed. And in the process of that delay, some of the other research and work and connections to the collaborators who eventually helped me produce this series matured. And so I was like, “You know what? The marketing cost of getting somebody’s attention on one volume is actually the same as getting somebody’s attention on three volumes. So let’s just be crazy and do all three at once.” This is a very strong graphic design system as a series. And that graphic design system is stronger because we didn’t design it for one book. We designed it with three books in mind at the same time. And I haven’t talked a lot about the team behind this, but we could start talking about the team by naming my creative partner. His name is Lorenzo Fenton, and he is an extraordinary designer. And he is the one who was able to understand what I wanted to do with this series and actually express it graphically. I would go to a certain height, and I would think that’s all that you could do with design. And then he would look at what I did, he would understand what I was trying to do, and then he would be able to take it even higher. But he would be able to take it higher and explain why it works better his way with almost mathematical precision because he’s just an expert on a totally different design field than I am.
CM: So let’s dive in. Let’s talk about Marey, the book on– well, I don’t know how to say.
RJ: The Graphic Method.
CM: The Graphic Method, yeah. I’m not going to try and read the French version of the title. I know that both of you had encountered Marey pretty early on. So I would love for both Eric and RJ to share a memory of when you first encountered his work.
RJ: So I think I didn’t know the name Marey when I first encountered his work. Because what I realized, digging into the history of information graphics, is that for over a century, he’s been kind of like the biggest influencer on other people who are more famous talking about information graphics since. So a familiar reference for a lot of people would be Edward Tufte. And Edward Tufte’s beautiful books. And if you look at his first book, you’ll realize that enormous amount of the graphics in that book are actually coming to Tufte via Marey because these are the same– these are the same images that Marey highlighted in The Graphic Method. And so Tufte was looking at Marey. And that sort of makes a lot of sense.
CM: How did you figure that out?
RJ: It wasn’t that there was a single moment. It was that you could see the graphics in Tufte’s working, you could see the graphics in other people’s works who were writing about the history of data individualization. Because how do you figure this out? It’s all tracing. It’s all looking at who are you citing and then going back and looking at what they’re citing and who is that person citing. That’s sort of like a quasi-academic way of kind of understanding the world. And so it’s all citation tracing. Through citation tracing, you keep seeing this Marey figure pop up over and over and over again. And then there’s also an awareness of him because Horse in Motion and Eadweard Muybridge is just an icon. It was used in the latest R thriller. Nope. Right? It was prominently featured in that. And so you know that and if you know that at all, then you probably also know a little bit of Marey’s chronophotography work. And so, there’s this spectrum or landscape emerging where it’s like there’s this figure who did this back at shit crazy chronophotography work. And also, he seems to be influencing all of these people who wrote about the history of information graphics. And then there’s the big discovery. And the big discovery is that he didn’t just make graphics or select graphics that he liked, he actually wrote about it. He wrote about it a lot. And the thing is, nobody knows that he wrote about it a lot because it’s all stuck in another language. And so that’s really the flash point, is that I start translating Marey on my own because I want to read it. Okay? And I’m on a message board. This is years ago. I’m on a message board and I’m like, “Hey, I’m doing this in a shared Google Doc. Does anybody else want to do it with me?” And one person is like, “Yeah, that sounds perfect.” And that person is George. And George is the co-editor of the Marey volume. And George and I have never met in real life. He lives in Berlin. And we’ve been working as fast as we can on Marey for years.
CM: I love that. I have so many questions about the translation process. But Eric, I want to hear your introduction to Marey because RJ, maybe you’re finding your way through the graphic method and the fascination with that. And Eric, you were really fascinated with the work that Marey himself produced and not the compendium that Marey produced.
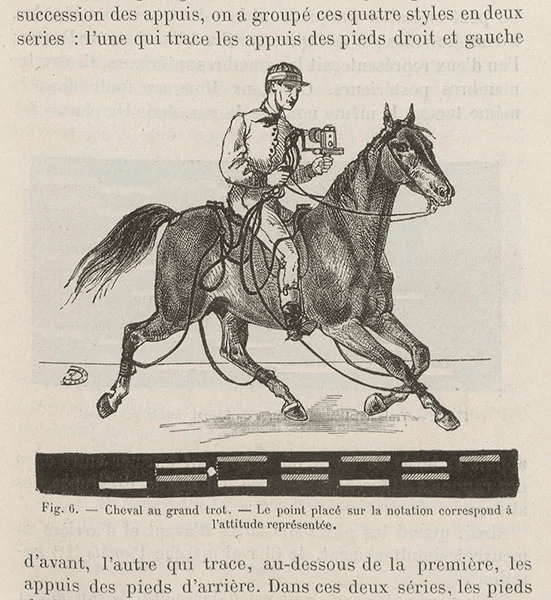
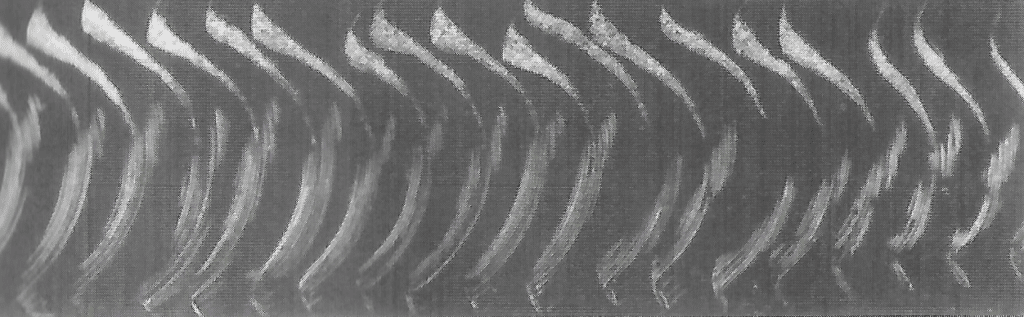
ER: Yeah, that’s right. I’ve been interested in mechanical reproduction since high school and just the making of marks by using machines. And then I found this book, which I’ll hold up this Marta Braun book called Picturing Time. I found this in a dog-eared bookstore on Valencia and 18th in San Francisco, maybe 19th. And just check out what he was doing. He was studying motion, right? And the way that he’s studying motion, he’s attaching pneumatic devices to the foot of a horse. And look at this guy, this guy is carrying around a rotating disk while riding a horse and using that to trace, to make these just astonishing graphics.
CM: We’ll put some photos in the show notes. Eric’s holding up a book.
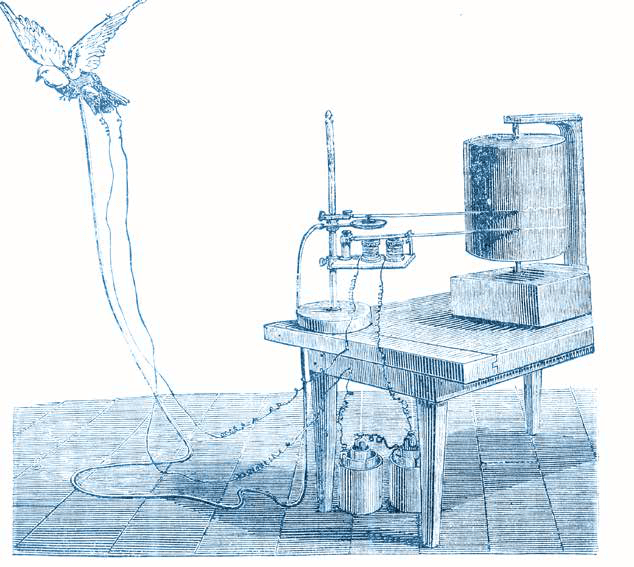
ER: Yeah, yeah, yeah. But here’s the really remarkable thing that he did. He wanted to understand how wasps fly. This is all pre-Wright brothers. And the Wright brothers actually cite Marey in their talks. And this motherfucker captures a wasp, paints the edge of the wasp’s wing with gold dust and introduces a rotating cylinder that’s been blackened to the wasp’s wing so that as the wasp is horribly, beating and trying to get away, he’s tracing that edge of the wasp’s wing on that rotating cylinder in 1868. And then he makes a mechanical wasp that moves based on those movements. And he does the same thing with birds. He’s attaching pneumatic sensors essentially to the wings of a bird.
RJ: I love that particular graphic because if you zoom in on the drum, you can see the chart that’s emerging–
ER: Yeah, yeah, yeah, yeah.
RJ: –as the bird flaps.
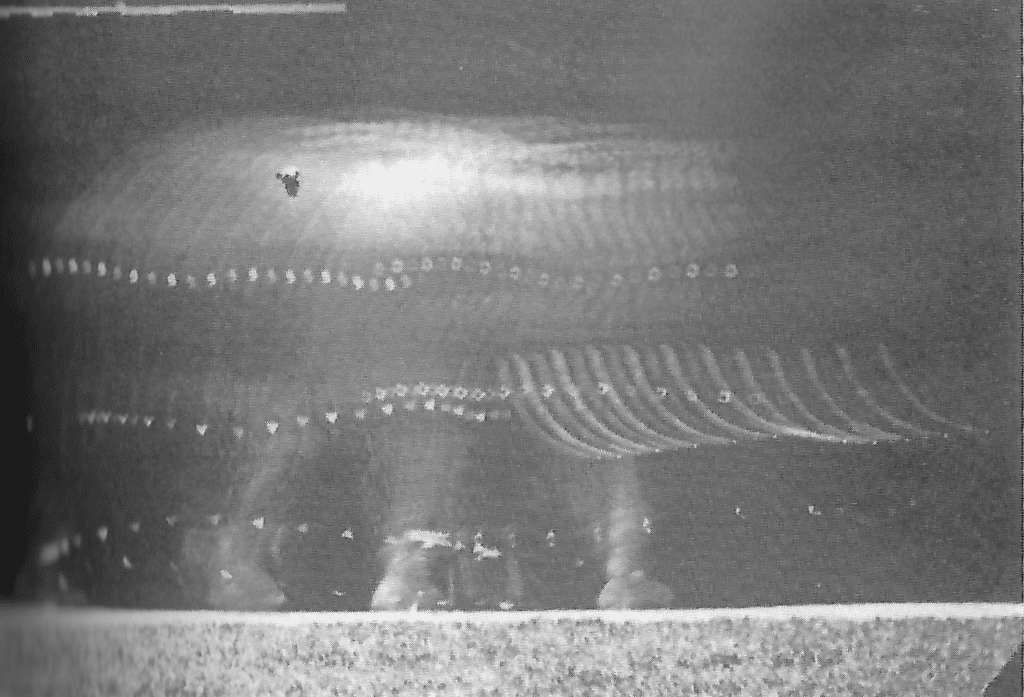
ER: Totally. And it’s a direct mechanical translation of the motion of the bird that’s flying. And then he makes these just astonishing graphics. I mean, that just come right out of it. And unlike Muybridge, he’s doing it very precisely. And the photography becomes a tool. It’s almost like there’s this accidental sort of amazing, beautiful quality to the photographs because he’s not thinking of them as kind of works of art. He’s thinking of them as things to trace. And so he does things like he puts the figure years in darkened rooms and attaches dots to their elbows and stuff and then makes charts out of that. I mean, look at this. This is an elephant. This is an elephant with dots on it in a dark room. And he’s photographing at very precise intervals the motion of the different parts of the elephant. And this is in 1887.
RJ: There’s an element to this work where you don’t understand how they are able to accomplish this. It’s just absolutely baffling across all of these stories. And even further is you realize that in some sense, some of these things you would not be able to produce today. It would not be possible to do what they did today.
ER: Why do you say that?
RJ: In particular, because a lot of the printing technology is just gone. I mean, maybe not with Marey. Like, yeah, you could take Chrono photography of and repeat a lot of his experiments, but in some of the other, especially the history of cartography, the engraving plates aren’t around anymore, and we don’t have the skills to actually engrave like that anymore. And so whatever was printed, that’s what you get. And even if we could do it, the tools to make the tools you need don’t exist. It would be tens and tens of millions of dollars. And do you know why it’s so expensive? Because it was actually that expensive back then as well. And you had the force of these first colonial world empires who needed to manage their empires and their funding project. Like, Murray is studying things like locomotion. It’s partially because they’re trying to figure out how you move troops around the world, right? A lot of these spectacular information graphics projects are funded by empires, and you actually need that much cash in order to do this work.
ER: Totally. And then it just speaks directly to the notion that these are artifacts of power and that they’re very much intended on the kind of domination that those places were doing. But then the other thing just to the thing about Marey that’s so amazing is that he essentially invents all the tools that you need to make a motion camera like a film projector, because what you have to do is you have to hold a film strip in a specific place for a specific amount of time repeatedly. That’s what Marey was able to do, but he didn’t take it and use it to project anything. It was Edison. But essentially, Marey invented the movie camera without meaning to, as a scientific instrument.
RJ: The movie camera, modern art, flight–
CM: Medicine.
RJ: Medicine.
ER: Yeah, he’s right there.
CM: I was reading on page, whatever, 18 of the book. I saw the device that I ultimately had attached to my body during a polygraph, right? Like the spirograph, where they’re, like, measuring your pulse and visualizing that. It’s just everywhere. It’s hard to almost imagine the influence of the numerous inventions. And now I understand the mechanisms behind it and the forces of empire-building that had to fund something so prolific or a creator that was so prolific.
ER: He was the first person, as I understand I mean, forget whether it’s first or not, but it’s the earliest one that I know about, about a non-invasive way of representing the human heartbeat. They would do it with dogs and stuff where they would stick needles in them or they had these things with frogs where they would measure stuff. But this idea that you could just measure a person’s physicality without cutting them open is profound.
CM: I’m curious for both of you, what are the teachings from Marey that you’ve learned either through your individual fascinations or through the book and the translation process that just feel like worth sharing with listeners?
RJ: What inspires me about Marey is his excitement for the field. H– his excitement for the potential of the field. I mean, he’s just always gushing with– look at all the cool things we can do all the time. I still feel that excitement. We’ve advanced a lot with data and graphics, and it still feels like we’re on a very low rung of the ladder. We have such a poor shared understanding of the world as a society. It’s certainly much better than it used to be.
CM: Is it?
ER: Yeah, I don’t know.
RJ: It’s still very fuzzy, right?
CM: Yeah.
RJ: I mean, maybe there’s a recent downward trend, but the arc over time is just or something.
ER: Let’s hope so.
RJ: So that’s Marey to me is his bubbling enthusiasm. And the fact that he was the first or at least a very early person to be writing so coherently and in such a total way about this means he didn’t have any of the established vocabulary because it didn’t exist. And so he uses very poetic language. And I’ve learned this from my co-translator, George, is that even for the time, his language is sort of odd and he sort of inventing phrases and ways of speaking about this craft, which, even though he’s a physician scientist and very meticulous, I still see all the poetry and art and sort of zeal for life throughout his work and particularly his words.
ER: I think that’s super well said, man. The gift of being able to have access as an English speaker to his first graspings for descriptions of these new things that he was bringing out into the world and his aspirations for them. It’s just fantastic to get. I mean, he’s talking about thermodynamics and talking about how he used the same thing to measure atoms as you do to measure galaxies. It’s marvelous. And he knows it, too, which is so great to finally learn. I never knew any of that. I knew that I felt that way about his work, but I didn’t know that he did.
CM: One thing I just want to go back to when it comes to the translation and reading his words in English is how much I appreciated in the book, the marginalia and the definitions that you and whoever you were collaborating with helped provide– as you’re trying to put yourself in the context of their world, but they’re using references to technology or whatever phenomenon that, “Yeah. We’re just not familiar with. ” And so it was such a pleasant way for someone who isn’t as naturally inclined to explore history as the two of you seem to be. And I’m like, “Now I understand.” It’s just making it so much more approachable. So I just really appreciate that.
RJ: Yeah. So for the listener, the main translation is all in black text and then there’s marginalia in blue. This is a direct throwback, right, to Info We Trust, which had a similar sort of conception. When George and I were working on the translation, we didn’t understand a lot, a lot of the words, and we made comments in a shared Google Doc. This is who this person was. This is what this word means. And at a certain point, it was like, “Oh, to understand this translation, you need that content.” And so we’re going to throw that in. And then the back half of the book is a survey of graphics because Murray constantly refers to other people’s work. What we did when we were working on it is like, “What is he talking about?” We want to go see that.
CM: Yes. Yes.
RJ: And so we went and found the images, found the links. And then, at a certain point, we’re like, “Oh, we should share that too because that’s actually really interesting.” And it required quite a lot of concentrated effort to professionalize all those links and add little essays to all the content that Murray was inspired by. But the format of the book is actually quite rooted in George and my process.
CM: And you can see that and feel it and benefit from it as a reader. So I’m so glad you made those decisions to include what you learned from along the way. It’s such a gift to people who want to really richly engage with Murray’s content and ideas and fascinations. We could talk about Murray for another hour and a half, I would think, but we’re not going to have time to talk about Emma Willard’s book. I am obsessed with it, though, so good job selecting a different editor for that one. But let’s talk about Nightingale and maybe start with the same question, when did you first encounter her work?
RJ: My Godmother was a nursing administrator at Massachusetts General Hospital. And so that means I was exposed to the history of nursing since I was a kid. And Florence Nightingale was on my radar in the same way that it’s on anybody’s radar who’s heard of her as a historic, important, perhaps the founder of modern nursing. Okay. So that’s one reference to point. I think the second big reference point is that she’s always trotted out as the token woman who did Datavis. And whenever anybody tried to tell her story, my bullshit detector went off, and I realized nobody really understood what this was about or what she did. And I started reading kind of what slim literature there was about it, and I realized it was wrong and that nobody had been the super nerd that I was to go try to figure it out. So this is sort of like a general interest of mine, and like a lot of interest, it’s just you spin the wheel and it keeps moving and you return to it every so often. But then I was commissioned by a new magazine, which is titled Nightingale, from the Data Visualization Society for their inaugural sort of launch situation. They commissioned me to write an essay about Nightingale. And so that was the first opportunity I had to go off and try to sort this thing out for myself. And I was able to sort it out well enough to put together 1,000 words for them. But it was very, very clear that there was a lot there that needed and deserved investigation. And so that is sort of like the second big point, was writing this essay. And then the problem with Nightingale is that her world is really interesting. She lives in a time period when London is full of familiar characters like Charles Dickens, Queen Victoria, and all these people knew each other and they all hung out, they all argued about everything. And there’s just an image of Victorian in London which is really, really iconic. And because Nightingale is so famous, everything about her was preserved. And so her world has sucked people into it for a century and a half. And I fell victim to her beacon. And so there’s a whole ecosystem of Nightingale researchers and archives that you can go spelunking in. And so that’s what I’ve been doing for the last few years.
CM: It’s clear. And I am not a scholar of her work like you are, but I don’t imagine anyone’s coming even close to connecting the dots in the way that you have.
RJ: I think that’s because I’m a practitioner, I actually make charts for a living, and so I’m interested in how charts are made. Whereas other people who have approached her come from the nursing angle or maybe a historian angle. Historians are interested in words a lot more than they’re interested in images, typically.
CM: Yeah. Eric, and this is someone who’s familiar, but not as quite a close friend to you as Marey?
ER: Yeah, that’s true. I know her work, I think. I mean, the classics are these Coxcomb Folios. Are these kind of like, here’s how they were dying before and here’s how they’re dying now. That’s pretty well known. I know a little bit about– she’s come under her own sense of reckoning lately, just with a lot of the changes that we’ve been going through the last couple of years. And so I’ve read stories about how she was held up as this paragon of virtue, but turned out to be more problematic than that. But I’ve known that she was a really interesting, aristocratic woman who chose to not live a life of leisure and chose to use her fame as a platform for getting things done. And in some ways that’s to me, the most useful kind of data point about her, is that she was not afraid to use her power to affect that kind of change. She didn’t make her graphics and then go home. She used the fact that she was who she was to get those graphics in front of powerful people, and struggled greatly to move the levers of power to make the change that she wanted in the world.
CM: That actually leads me to a question that we have all considered, and I think it’s something that you must come across all the time, RJ. Studying historical figures is like, everyone has shortcomings, right? Or the societal circumstances that create the funding and power of an empire builder funding Marey’s work, or Nightingale being a really huge supporter of British colonial rule and her ties with Christian ideals of cleanliness. But how do you just grapple with the harm of historical characters along with the good of their contributions?
RJ: The editor of the Emma Willard Volume is a professional historian. She is a professor of history. So I landed on a metaphor which satisfies me on this topic while talking to her, which is like, don’t fall victim to presentism. So presentism is you think you’re on step 10 of the staircase and you’re looking at somebody who’s on step 4, and you’re looking down on them. That’s presentism. Don’t do that. What you should be doing is that you should be looking at somebody who’s on step four and realizing that despite them having enormous baggage. They are in some ways still climbing up to step 5. And climbing up to step 5, they are hauling some of that baggage along with them. But isn’t it remarkable that they have advanced and done something wonderful, at least in one dimension of their life? Let’s focus on that one dimension. Let’s not exclude all the baggage, but let’s focus on that dimension and learn something from it, and be inspired from it. Because we’re on step 10. But guess what? The staircase is 100 steps tall. There’s so many more places that we need to go and we need to figure out how we can go to step 11, not aware of all the baggage that we’re all carrying. And we still have to figure out how to do something remarkable ourselves. And so let’s figure out how they were able to climb a step, even though they’re under all of this weight. And so what the series does is it doesn’t necessarily celebrate the craters. It celebrates their work. What work did they do that was so remarkable?
CM: I really like the way you put that. And I’m reading articles, and one of which from a nursing publication, The Racist Lady with the Lamp. And I don’t think anyone’s arguing, like, she’s canceled now, right? It’s undeniable, the important contributions. But I think people are also suggesting who else was influential and maybe didn’t have quite the access or privilege. And perhaps we can find people like that and make visionaries books about them.
RJ: And the classic example of this is Abraham Lincoln. Abraham Lincoln, I think, is properly celebrated. But if you look at his views on Slavery Circuit 1859, 1860, you might become uncomfortable. But guess what? That guy still did a good job. We still like Abraham Lincoln. And so if you want a really clean engagement with the world, you are not going to do anything interesting. You want to do something interesting, you got to get in the mud. And because that’s reality. Reality is chaos. It’s a disaster out there.
CM: That’s credit to you for forging forward with these historical figures and bringing to light their stories, taking into account the full picture of who they were. So that in itself is one of those diving into the chaos moments.
RJ: Look, it’s all we got. The book of inspiring information graphics by Blessed Saints would be empty [laughter]. Well, as a side note, the sort of racist attack on Nightingale has a particular recent history. And Nightingale scholars are really pissed off by it because they believe it’s untrue and it was perpetuated by a particular personality at the BBC who was looking for clicks. So there is a very specific recent history to everything you just said, which my cards are on the table. I’m a fan of Nightingale, and I think it’s bullshit. I mean, Nightingale is the granddaughter of the man who fought to abolish slavery using information graphics. I mean, there is an insane tradition of fighting for social progress with information graphics from her family. She grew up with the Darwins, the Priestleys, the Galtons, all these people knew each other, right? And they’re all using information graphics throughout the 1800s in order to advance science and in order to advance social progress, which they didn’t see as that different.
CM: I like that you added that in. What else do you feel like Nightingale we should touch on?
RJ: The Nightingale book is insanely focused on craft. Meaning, why did she do this? How were they inspired? What was her motivation? The months and months ticky-tacky of kind of how this actually happened. And what’s incredible about her story is that we can see the evolution of her design. She published her Crimean diagrams across six different publications, and then she wrote to all of her collaborators about them. And then the biggest discovery of this volume is that we found draft diagrams in the British Library. And so we have hand-undrawn draft diagrams with pencil edits. And, I mean, it’s like, “Hey, make this style instead. Then use this color instead of that. Change the composition of this graphic so the text is over here, so it’s a more balanced composition.” We have reference this prior work by somebody else who I really like. All of that craft work we have and we’ve put together so you can understand how this actually happened. How does a masterpiece– I believe her work is a masterpiece. Or if it’s not a masterpiece, it’s the closest thing we have, right? In terms of an icon. And how does that actually happen? That story is told.
ER: I think what you’re also doing, RJ, is you’re calling data visualization a masterpiece. And I think that’s a way that maybe we’ve been reluctant to talk about, or that it’s just not as easy to talk about, there being these kind of actually useful and groundbreaking works by humans in the field. And they needed to be invented, right? It didn’t exist before she did that.
RJ: And invented in the sense that actually it’s invented in the same way that we invent things all the time, is that she had a particular set of constraints and a particular set of goals. And she went and grabbed the brass ring, but she didn’t know she was grabbing the brass ring. She was just trying to fit her own craft into what she had to do that day.
CM: Yeah, there’s a bigger goal at hand. Right? She really was fighting for something and had to just use whatever resources.
RJ: The Emma Willard graphics are really nutty. They’re really nutty. I’ve tried to recreate them digitally, and I can’t. They’re too wild. And in some sense, they weren’t as successful because they’re too wild because it was very, very hard for anybody to imitate them because they’re just that spectacular. And we are stunned by how spectacular they are, And it’s easy to lose the focus of what she was doing, which is she’s trying to educate young women, and specifically, she’s trying to sell textbooks. That’s why we open that book. The first image you see is a painting of Emma Willard when she’s a schoolgirl, and then the last image you see in the book is a student’s copy of one of her graphics. And so a manuscript copy from the 1850s of a schoolgirl who copied one of Emma Willard’s charts on her own. It’s nuts that both of those artifacts survive. We want to keep you rooted. Yes, these graphics are spectacular, but they served a purpose in their own time.
CM: It’s so cool to have that context. As I was reading this, I just felt like you were just– and maybe I mentioned this earlier, a modern day collaborator. You’re just inserting yourself into their workflow for today. Does that feel like an apt characterization of your relationship with these figures? After spending so much time scrutinizing their words and their work and looking at their handwriting and things like that? You got to find some deep intimacy with these people, no?
RJ: Yeah. One of the ways I describe my interest in the historic graphics is that you can use survival bias to your favor. I consume a lot of current information graphics all the time, and that’s really useful. And I’m not a movie nerd, so I only watch the classics of really famous films. And historic graphics is similar, is that when you look at historic graphics, you’re probably going to look at really, really high quality work. And it’s really, really high quality work that was created in a different context. And so different information solutions are probably at play than would naturally come to you today because your constraints are different. And so today we have tools that kind of send us down certain paths. And you can look at a historic piece and say, “Oh, look how they made this– look how they labeled the axis on this bar chart. I’ve never seen anybody do that today. That’s really clever.”
RJ: And so my relationship with these visionaries is actually a relationship to their work because I’m sort of always hunting for new angles, tips and tricks, ways of doing things, ways of conveying information because we are in an attention business, and we have to attract and engage attention. And one of the ways you do that is you present something familiar in sort of a new and weird way.
CM: I like that. So I guess I just want to kind of bring it home with a question about how it feels now that you’re on the other side of this incredible journey and labor of love and you have this vision for so many years and now you’re seeing it out in the world. So what is that like for you?
RJ: It’s a relief, is the big emotion right now. Producing a real thing is extraordinarily hard. I mean, we imported 11,000 of books into the United States from Europe. That’s hundreds of emails, dozens of PDFs, multiple languages. Stress. A lot of stress. An enormous amount of stress. Also, I produced this book at a time when I was also working on COVID, when I was raising a young family. Writing Info We Trust, I had the privilege of being precious about it and having my own personal, creative routine and going for walks and thinking about things. That is not how this series came about. This series was put together by professionals with almost a blue-collar kind of attitude who showed up and did the work whenever they were able to. And I think that’s really good. I think it’s actually really good not to be precious about your work and just show up and do the job, right? And that’s how this– that’s how this book series emerges by professional people who are really, really good. Either they’re experts or artisans, really, really good at their work, showing up, and doing the job. So there’s a sense not of joy which you might get with a precious work. There’s a sense of relief and satisfaction.
CM: So I guess, what’s next for Visionary Press and the Information Graphic Visionary Series?
RJ: So the next thing for Visionary Press is we got books to sell. So we’re selling them directly from visionarypress.com and I printed a lot of extra books and we need to sell these extra books. And we are shipping worldwide, everywhere, so please go check out the books. That’s what’s immediately next. Based on how many books we sell, we will have more visionaries. I have very, very high aspirations for where this series could go. One of the concepts of the series is that there’s– information graphics come from all kinds of different places. It’s very intentional that we have multi-languages, multi-time zones, multi-crafts, very different types of information graphics in these three books. And that sort of stakes out a landscape. And in the future, I don’t want to play within that landscape. I actually want to push that landscape even further. And so I haven’t said this aloud to anybody but my interest is actually to go beyond Western languages. And so we have French and English represented. We have a Frenchman, a British lady, an American lady. That’s what we have right now. We have somebody who did great stuff with maps, somebody with science diagrams, somebody with persuasive kind of propaganda kind of charts very public facing. It’s different crafts, it’s different geographies. I want to push that landscape beyond, not that I want to redefine what information graphics are. We have a very well-defined lane but there’s a lot more out there to incorporate to really help refine what an information graphic visionary is.
CM: That’s a Pollinate exclusive. You heard it here first. Non-Western languages. Coming soon. You answered my second question but let’s remind people again, where can they get their hands on a copy?
RJ: Visionarypress.com.
CM: I bet they can order in time for the holidays. Well, depending on when this airs, actually. But you can do with that what you will. All right, peeps, I guess that’ll bring us home for another Pollinate episode.
CM: Be on the lookout for some bonus content later this month where we go into depth with RJ about exactly how these books were created. It’s an epic journey that I think you’ll enjoy. And thanks for listening to Pollinate. Thanks especially to RJ for our great conversation. This episode of Pollinate was written by Eric Rodenbeck, myself, and Ross Thorn. Music for Pollinate was created by Julian Russell. You can find the Information Graphic Visionaries Series at visionarypress.com. To learn more about RJ and Info We Trust, visit infowetrust.com. If you liked the show today, be sure to share it with folks who might find it interesting. You can also tweet at us on Twitter at stamen using the hashtag PLN8. For a summary and full transcript of today’s conversation along with some other visual examples that we discussed in the episode, check out the blog post at stamen.com/blog.