
What is a map, even? A cartographer might answer that question with a focus on the geospatial, whereas an information designer might focus on the conceptual. In this episode, author Carissa Carter offers a definition of “map” in her new book The Secret Language of Maps that is somehow broad and very specific at the same time, encompassing any visualization that conveys its message through spatial means. She shares a few lessons from her book on how to deconstruct maps, examining the pieces in detail to give us a better understanding at how to put them back together and use them to understand the people and phenomena they represent.
Carissa is the Academic Director of the Stanford d.school, who came to her role in design, art, education, and visual storytelling through a fascinating path that includes an advanced degree in geology and a fascination for maps and sense-making. The streamgraph depiction of her career arc below made for a great starting point at exploring Carissa’s history and inspirations.
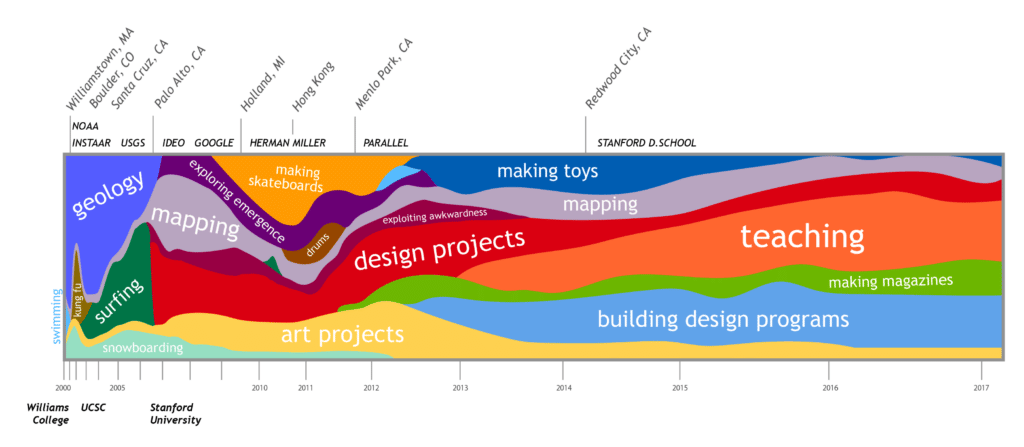
Image: © Carissa Carter http://www.snowflyzone.com/
In the book, Carissa explores the “mappyness” of various images in text and visualizations like the continuum below, ranking them with how they adhere to her inclusive definition. In a lightning round game, Carissa ranked a satellite image, a board game, and a Venn diagram in an order of least to most mappy.
She also proposes another deceptively simple question: what are the key ingredients to a map? Before reading, I might have answered this question quite literally— perhaps saying that a map must have a title, a series of questions to answer, a cohesive visual encoding system, and a legend. Another way you could answer this question might heavily focus on the quantitative information contained within a map, but this book zooms out far beyond data and visual encoding systems to acknowledge the humanity of maps, and how their emotional, analytical, and political perspectives play a role in the creation and consumption of them.
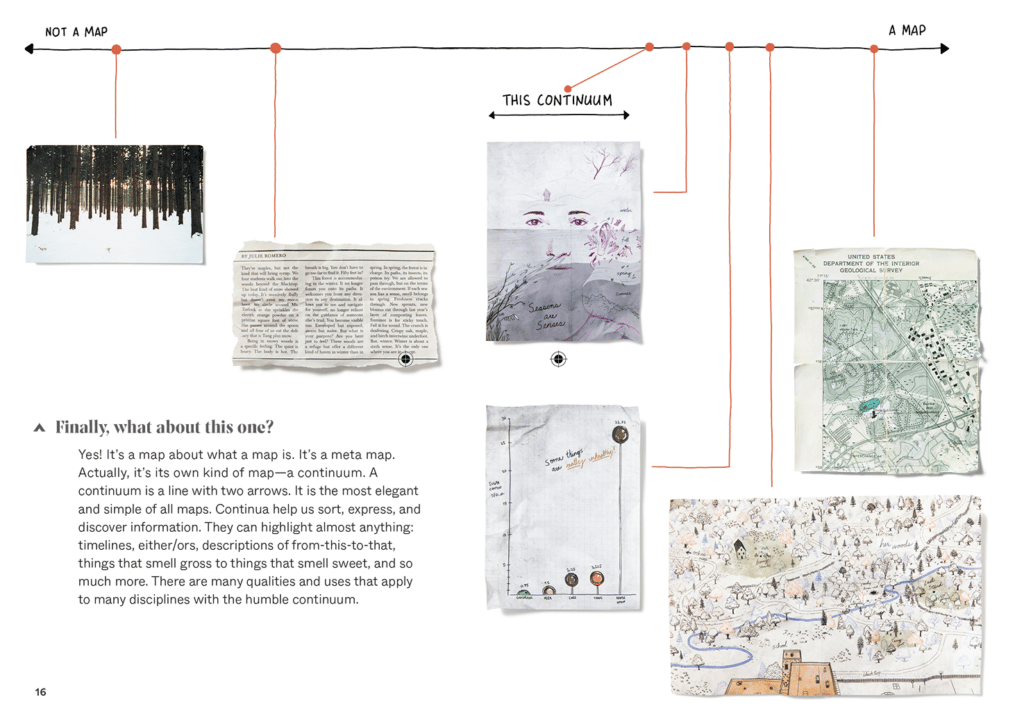
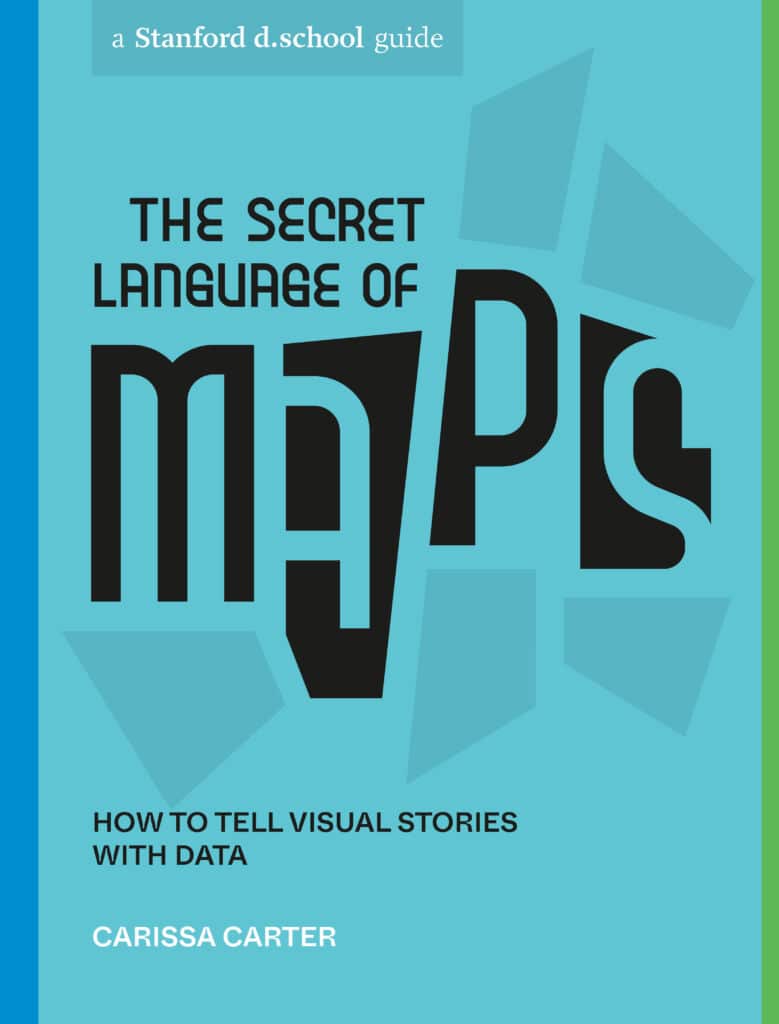
Image: © 2022 by Jeremy Nguyen and Michael Hirshon (illustrations)/courtesy of Ten Speed Press/Penguin Random House
The book is rich with examples of different types of maps, how to interpret them, and how to create them. Each example serves to illustrate the three components of maps as identified by the author: craft, bias, and data. In other words: how the map is portrayed visually, the implicit and explicit expectations or messages within the mapmaker and viewer, and the information that the map is showcasing. Carissa cautions those who say that data is everything, but that it is merely one of these three things that make up a map. One of my favorite moments was connecting these concepts to the concept of “multiple ways of knowing” developed by Elissa Sloan Perry and Aja Couchois which poses that there are “many different ways to understand and engage with the world – including through your experiences, through art, and through ancestral wisdom. Privileging one way of knowing over others marginalizes and ignores truths that come from other ways of knowing.”
In anticipation of our conversation, I decided to create my own map of the book’s structure. Inspired by Carissa’s examples and encouragement to “loop through the data” and “explore before explain” I ended up creating multiple versions to depict the shape of the book and the reader experience. It was such a fun moment to share these images with her!
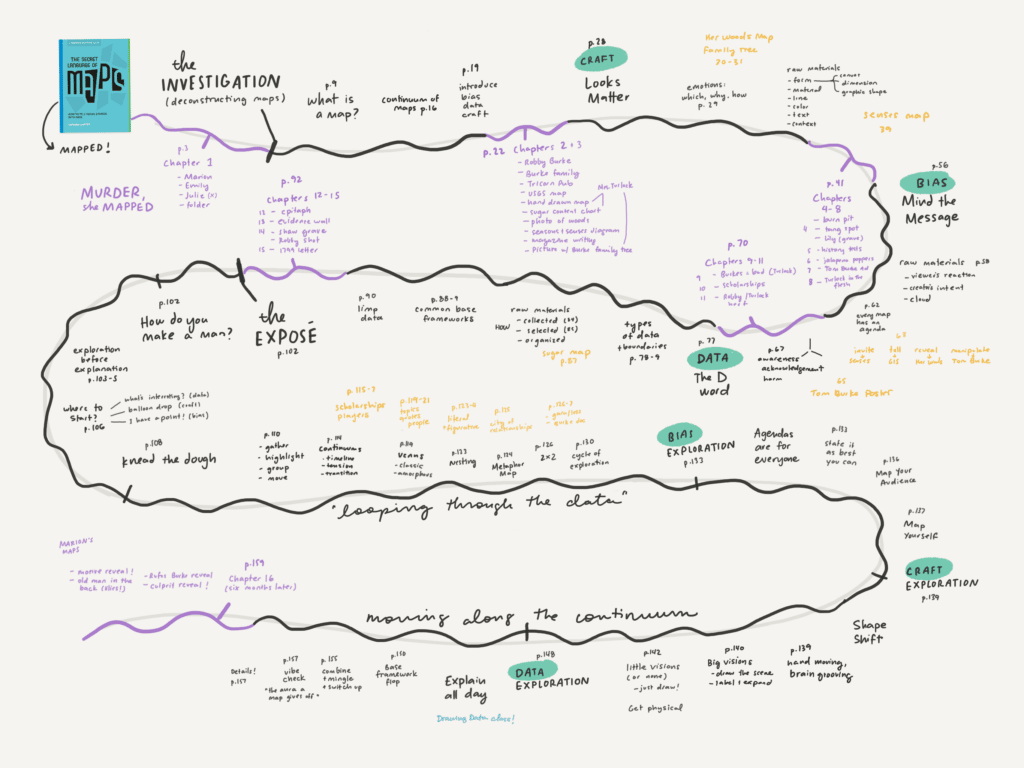
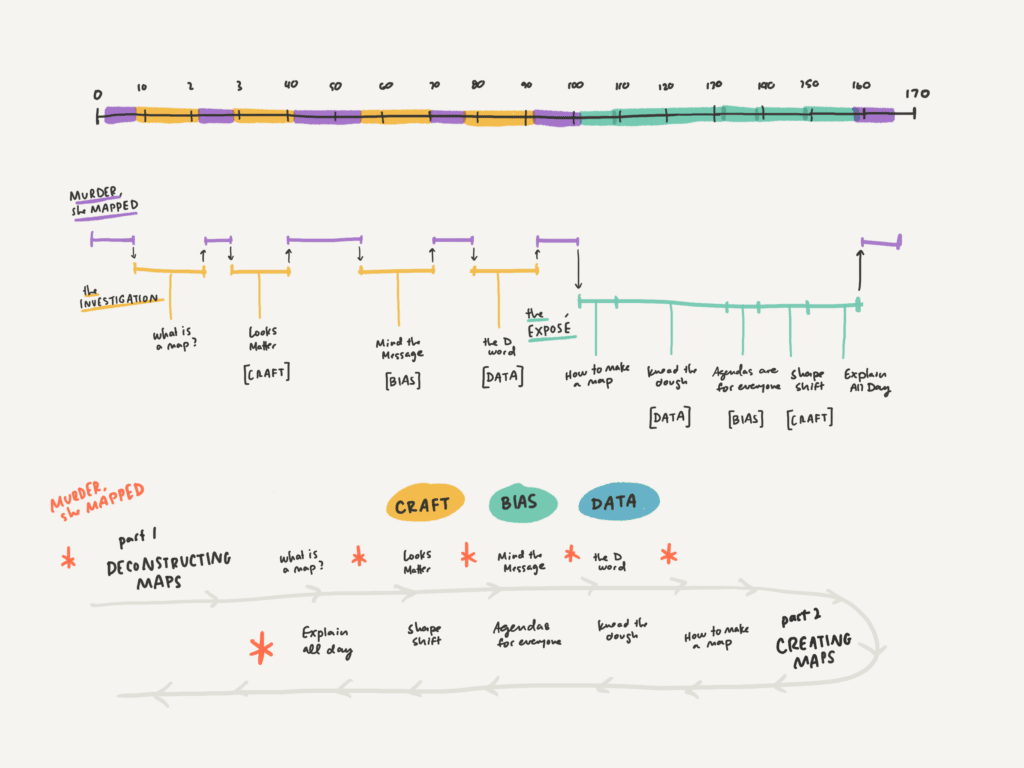
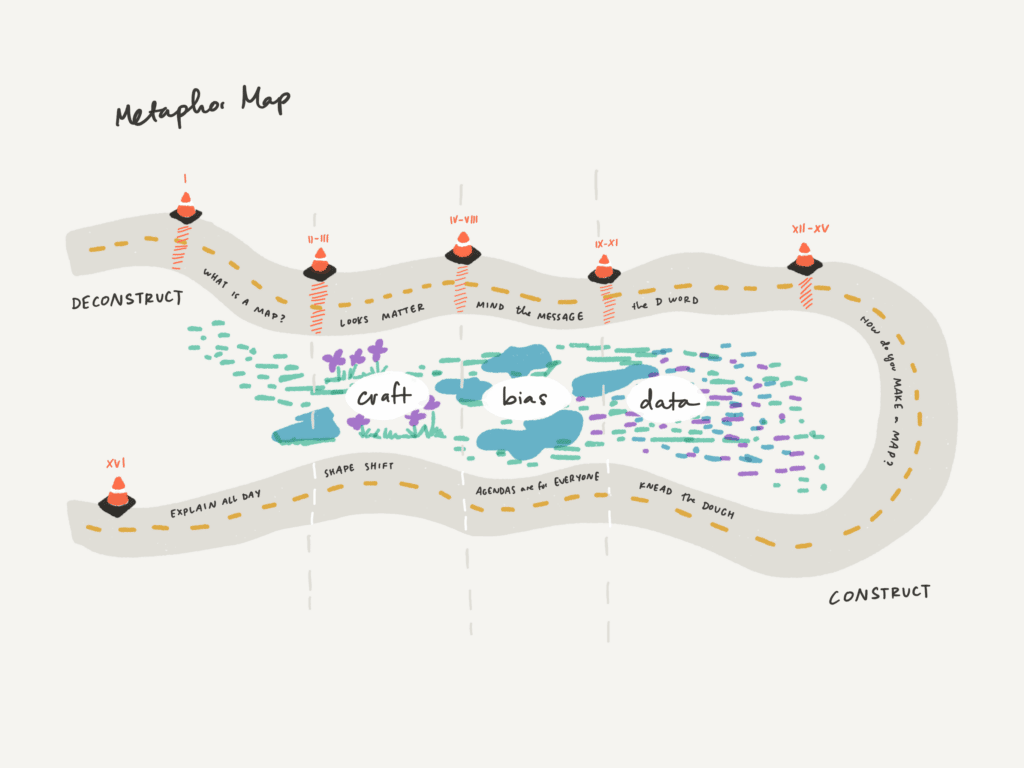
Images: © 2022 by Catherine Madden
Oh, and did I mention that there is a murder mystery woven throughout? If you’re curious about how Carissa pulled all of this off in only 175 pages, I was too. In the episode, we discuss the inspiration behind the format, as well as the logistics of putting together such a uniquely structured book.
Grab your copy of The Secret Language of Maps and start critically deconstructing the maps you encounter through a new lens! Got thoughts about maps? How would you rank a satellite image, a board game, and a Venn diagram? We’d love to hear about it on Twitter! And if you enjoyed today’s episode please help us share it with anyone that might be interested!
Transcript — +
[music] You’re listening to Pollinate, a podcast on data design and the people that bring them to life. Brought to you by Stamen Design.
Catherine Madden (CM): Broadening the definition of a map, how we can uncover the hidden agendas within them, and how a Trader Joe’s bag salad makes the perfect data set. These are some of my favorite topics that we cover in today’s conversation. I’m Catherine Madden, a friend of Stamen, information designer, story strategist, and facilitator. In this episode, you’ll hear our guests dissect her new book, the Secret Language of Maps: How to Tell Visual Stories with Data. And we’ll explore the building blocks of maps and why people love them. Please welcome my guest.
Carissa Carter (CC): I’m Carissa Carter, and I’m the academic director at the Stanford d.school.
CM: Welcome, Carissa. It’s so fun to be talking to you today, and I have so many questions. I’m so excited about this new book you put into the world, the Secret Language of Maps: How to Tell Visual Stories with Data. And when you emailed me as part of, “Hey, everyone, I put a book out into the world,” I was very excited to invite you on the podcast to talk about it.
CC: Thank you for having me. It was amazing to get a response to that email and from you, no less.
CM: Oh, well, it’s been, what, like five– no.
CC: I think more.
CM: Probably more than that, seven or so years since we crossed paths. So–
CC: Seven-ish years, right.
CM: It’s lovely to be back in connection. And yeah, maybe we can start with who are you on a deeper level other than your position at the d.school. In my research, something Ross pointed out for me, Ross our producer, is your website Snowflyzone.
CC: I feel like a little disclaimer is needed there.
CM: Go for it.
CC: Back in maybe ’94, when it was time to decide the identity I was going to have online for the rest of my life, I did a brain storm and I landed on Snowflyzone, and I just can’t let it go. It’s my Twitter handle. It’s my website. What it means and what it’s for, I don’t even know anymore. But I love it and I can’t get rid of it.
CM: I love it too, and I love that it is like an artifact of former self or a part of you. I similarly have a handle that Kat Mule is rooted in nicknames from childhood and my maiden name, which I have since changed since getting married, and people don’t understand where it comes from, and I don’t care. I don’t need to explain it.
CC: Right. You don’t.
CM: Snowflyzone. Is this like sort of like me, too? I have a just very neglected website. Is this something you only semi-occasionally update?
CC: Oh, yeah. Yeah. The minute that you mentioned my website, I cringed just a little bit thinking like, it definitely wasn’t in the 2020s that I’ve last looked at it, but maybe in 2015, 2016.
CM: I very much relate to that, and there’s still a lot of really good background information on it that we can use as a starting point.
CC: Great.
CM: I’m really in love with this sort of, like, visual, I guess it’s like 100% area chart, a filled area chart, with sort of blobs representing all of the different, I call it, slices of life, that were taking up your identity throughout time. And yeah, I want to maybe start with that. Like, your education. Looks like you studied geology and got several degrees there and then moved into there’s, like, this really seminal moment in, like, let’s see, 2006 2007 area.
CC: About 2006. Yeah.
CM: Let’s talk about that. Geology sort of gets small, and mapping gets really big, and design gets really big. So what’s the story behind that?
CC: Well, my first career was as a geologist. I studied geology as an undergraduate, and then I did do a graduate degree in geosciences as well. And I love it as a discipline because of how interdisciplinary it is. Right? You’re trying to make sense of history. You’re finding things in the field, you’re modeling things on the computer, you’re doing experiments. There’s so many different layers to bring it into geology. And then I found myself working as a geologist, and I was at this crossroads moment where I was like, “Well, this isn’t everything that I am.” The world needs people to pursue a tiny slice of truth that is scientific pursuit. But I didn’t think that was me. And I had always had undercurrents of art. I never knew what design was. I had never really been introduced to that as a younger self and found my way kind of by chance, by faith, in this next career as a designer.
CM: And did you pursue another degree? Or was it–
CC: I did. I think I like school. I like going to school. I now teach. I like learning. I like deconstructing learning. That’s all a part of who I am. So if I could go back, maybe I would, maybe I should.
CM: So you are a geologist working at NOAA USGS. And then you were like, “What is design? I want to learn more about this.” And just sort of–
CC: Right. As a geologist, I started geomorphology, right? So the processes that shape our landscape; rivers, glaciers, sand. I was looking at how rivers erode, and they erode either by abrasion, right, where rocks rub against each other, dissolution where the water will dissolve something that’s in the rock, or quarrying where things chunk off, right? And those are all things that come together to create the shape and allow our landscape to evolve. And I love it, right? I love thinking about how nature shapes the world we’re in. And then, if you kind of expand that out to design, I like how humans shape the world that we’re in. And you kind of can spin yourself into a flurry of, like, “Oh, my God. What does it mean?” Like, what’s our purpose? But really what it comes down to is I like thinking of the intersection of people on the planet, right, and how we make sense of it all.
CM: Well, then it makes sense that the mapping came in sort of big at the same time as design, and it was a part of a thread throughout the geology era as well. But was it just a natural sort of shift of focus from geology into mapping?
CC: Well, I mean, I think mapping, or the way that you present what you’re looking at, that’s a bit of what I call mapping in a geology sense, right. That was always there for me. I’ve always been interested in how we convey the science that we’re exploring, and doing that in a visual way feels critical. And so that red thread of how we explain what we’re doing and how we actually make sense of all of the information around us, that’s been there for me all the time, and that has kind of pulled me through. On paper, it seems sort of drastic to go from geology to design, but the maps are kind of the thing that connects it all.
CM: And, as I was asking that question. I realized– and this is something I want to get into when we start diving into the subject matter of the book. But it’s almost like I forgot what you wrote and how you defined maps, because I was thinking about geospatial and then you just reminded me that maps are many different things in addition to geospatial depictions of Earth or other places. I’m just excited to get there, but I just want to spend a little bit more time on this visual, which, for folks listening, we will include in the show notes. I just have to ask about exploiting awkwardness as a slice of life. Say more about that, that moment.
CC: Oh, man. I love when you’re in an awkward situation. There’s just something so beautiful about being out of place for whatever reason. And I’m somebody that, like, I take my work really seriously, but try not to take myself too seriously. And there’s something about awkwardness in there that I love. And then, also, right, sometimes you view a situation or a group of people and they’re clearly out of context in an awkward situation. A lot of design is founded on that, right? Like recognizing these moments of discord and finding an opportunity through it. And I find it amusing in the most productive way forward. We’re all here to hopefully enjoy each other and be able to laugh our way through the awkwardness.
CM: I really love that. It’s not a huge slice of your existence over time and, in fact, it seems to have waned out. But I’m sure there’s a bit of it there, just not in comparison to the other slices that are growing.
CC: I think somewhere on one of those Snowflyzone bios, I describe myself as an awkwardness enthusiast still. But yeah, when you’re thinking of it in terms of my visual resume, there was a time when I was actually doing experiments with making little design interventions and seeing how I could either amp up or pull back on the awkwardness of different situations.
CM: I’m thinking about how funny it is that we’re talking, and I don’t know if I knew that you had like a visual depiction like this of your work, but I have an almost identical one that I created when I was, maybe like 10 years ago, starting out as a freelancer and wanting to tell my story. And then I created a skillshare class on creating visual resumes.
CC: I don’t think I knew that.
CM: I know. So another reason that we are kindred spirits and–
CC: I love it.
CM: –need to talk more than every seven years.
CC: I know.
CM: I think this is a good next question from sort of this geology to deciding you’re going to explore design and then really staying in this academic setting in many ways, but is there anything else from your background and your work and your experience that made you want to write about visual stories and dedicate a significant amount of time and effort into putting together a book on how to tell visual stories with data?
CC: Yeah, well, I’ve taught a class for the last seven or eight years that is called The Design of Data. Before that, it was called From Maps to Meaning. And I’ve had several different co-instructors for that class. The last four-ish years I have taught with a geoscientist, Kate Maher, who’s a Earth science professor at Stanford. And in that class each year, we deconstruct the topic of designing with data more and more. And I have felt, I think, as somebody that’s very interested in data literacy and what that means, I was very excited to pull that into book format and make that accessible to anyone. I think that’s another thread. That’s another thread that I think I feel really strongly about, is making topics that feel inaccessible to some people, open to them.
CM: That is actually a huge theme in the sort of book club that we formed within Stamen. Some of the folks that work on the podcast like to get together and collectively outline what we want to talk about with authors who are putting out books and wanting to share them with the world. And we were also fascinated by the approachability and the different vibe that this book had than a classic textbook or something else that, having many trained cartographers and people who went to school for geospatial depiction and I don’t even know how to describe it because that’s not what I went to school for, but it’s just a much less, “academic approach” in its feel. And that’s something we all really appreciate it. And I have a lot of questions for you about that. But before we dive in, I want to just give you a chance to describe the book in your own words and sort of the general thesis that you’re exploring throughout it.
CC: The book, The Secret Language of Maps, is about telling visual stories with data. And when I say map, I mean infographic, I mean framework, I mean data visualization, data story. I’m using those words in a very inclusive, it all means the same thing type of manner. And really it’s about how to use some mapping techniques to explore the data or the world around you and find what your data story might be, as well as create visualizations for others to see, as well as make sense of the infographics that you see in the news and things like that.
CM: I love that. And I think a huge aspect of this book that is important to explain in this early juncture is that there’s a murder mystery woven into the story. And when I read it, I mean, let’s see, it’s 100 and, what, 75-ish pages, cover to cover. And I read it in one sitting. And I think it’s precisely for that reason, because I was dying to figure out who done it. And again, that speaks to the difference between another different form or perspective or audience in mind for this book. And I’m just so curious how you arrived at adding that into the murder mystery in that form into the book.
CC: Yeah. I mean, I found myself– from the nonfiction perspective, right, I’ve taught this class for all these years. I knew what that part of the framework was going to be. But then, I really wanted to create a book that could equally live on your bedside table as well as on your desk at work to hit both those modes. And that’s where making a murder mystery initially started was, could I have something that lived in multiple spheres of somebody’s life? And then also, who doesn’t want to read a murder mystery? Why not? Can we pull it in there? Anything can be mapped. So why don’t we use maps to unpack the mystery and figure out what happened?
CM: I love that you asked why not and then did it, because I think it’s really working, and it was such a fun read and a different approach to some subject matter, which could be like, supremely boring. I mean, not to people like me.
CC: Me too. Right? But you called it out, though. I’m never going to be the most accomplished infographic artist. That’s not who I am. I’m somebody that can pull apart how things are working. So that’s the piece that I needed to focus on.
CM: I really appreciate knowing what you’re fascinated by and what you’re good at and leaning into that. And that actually leads me to a question on that topic of, you’re not going to be the world’s greatest infographic creator. It’s still full of really fun and playful visuals that help bring the written word to life and help clarify concepts. Again. Before we dive into the content of the book, I am very curious to ask about process and how you developed it because there’s a lot going on. You’ve got two-part series interwoven with the murder mystery, so lots of images.
CC: That was no joke to pull off.
CM: Reading it, I was like, how did you keep yourself oriented in this process? And how did you decide when to include a visual and what was the process in developing that visual? And that’s five questions in one. So maybe–
CC: Let me talk you through it. I was writing the fiction and the nonfiction in parallel. How they eventually came together was in a week of really trying to make myself in a bubble and print the whole thing out. I had it in pieces all over the floor of our basement and was moving around the parts and pieces, because it really does have to go in the order that it’s in. The visuals themselves, if you read the book, they’re in line with the text, meaning that a visual will come and it will really be a build off of the sentence before it. So it really mattered where the visual fell on the page, which is something that, without the talent of the editing team at the publishing, Ten Speed Press, would never have happened. Because that is very hard to do when you’re also now adding the element of layout.
CM: Yes. And then if you add a paragraph and all the pagination gets off– yes, I’m familiar.
CC: Yes. So there was that moment when Kim Keller, who was my editor, she’s like, “You need three words from this sentence have to go if you want that visual on this page.” Right. And so we were down to the minutiae at that point. Yeah. So actually pulling off having all of these things together was the result of having a really amazing illustration team, a really fantastic creative team at the d.school and at the publisher. And it was not simple at any moment in time. And I’d love to tell you about all of the different groups and how we all work together.
CM: Yeah. One thing, in particular, I’m curious about, having worked on– I illustrated Cole Nussbaumer Knaflic’s now second book, Storytelling with Data, the workbook. What was it like for you working with illustrators? Did you sketch something out before giving them the prompt or how did that work?
CC: Yeah. So Jeremy Nguyen, who did all the illustrations for the nonfiction part, and he does a lot of illustrations for The New Yorker. We did a lot upfront of working on, well, what’s the visual style this is going to have. And I’m sure he wanted to pull his hair out at one point. Right. Because it’s like, “Well, it’s got to have more of this element of playfulness, and not too much.” So we spent a lot of time upfront getting that vibe. I actually did the first draft of every one of the illustrations and then passed it to him to do his magic and transform it into the illustration that you see in the book. Because I am visual, I do like to draw. I’m just not at illustrator-level capability. I’m more of like a, “I got some good chicken scratches in there.” And then they can convey a thing or two.
CM: And they get the job done, so I–
CC: They do.
CM: Yeah. I encourage people not to judge their own drawings and also know when to seek help.
CC: Yeah, absolutely.
CM: It seems like you nailed that balance.
CC: Absolutely.
CM: And as an illustrator, I really appreciate someone who has formed an idea of what they want it to look like and then is incorporative of whatever input and thought I have around how to make it more clear or interesting. So seems like a good balance.
CC: Right. When it’s a team effort, right? Man, there is nothing more satisfying, right, than you, like, here’s what I think it should be, pass it off to the illustrator, and they add these flourishes or their own interpretation of it, and it’s something that you had never even thought of yourself. And to me, that was the greatest gift. It just makes the whole thing hum. And both Jeremy did that as well as Michael Hirshon, who did the illustrations in the fiction section of this book.
CM: Oh, yeah. I hadn’t even really thought about that. They are totally different. That explains the two different illustrators named.
CC: Two totally different styles. We did that partly because you always do show up in your own work, and we really wanted that. I don’t want to give too much of the mystery away, but somebody is authoring this.
CM: It’s like a book within a book.
CC: Exactly. It’s a book within a book.
CM: It really feels like you’re transported when you go back into the murder mystery section. And I think changing the aesthetic from the page color to the image qualities is a really good design decision. And as a reader, you just feel like you’re in a different zone or mode of absorption.
CC: You mentioned the page color, and there was a slice of time where we were actually trying to do a different kind of paper for the fiction. It was of the Nancy Drew paper quality. And that was like one click more than we could pull off, because it had to be by signature, so by section of chunk of pages within the book. And I could not get the length to line up to make that work. But that was on the table for a little while.
CM: My first year and a half as a designer was in a print shop, and we played with, like, double gatefolds, which we do get a double gatefold in the back of this book. I’m so happy for that. And then, we have all these great ideas as a designer, and then you go to the print shop and they’re like, let me tell you how this actually works. Like, “Oh, so it’s going to be like $20,000 to print like 15 of these brochures. Never mind.”
CC: Right. Right. I had no idea how complicated of a process bookmaking was until this. I have a whole new appreciation for it.
CM: Going back to how much is contained within this book, I want to show you something. It’s been a while since I’ve just played around with constructing my own sort of visual forms. And because the book was so complicated, I decided I wanted to take a note from the book itself and map it out. So–
CC: Oh, my God, this is so cool.
CM: And in the spirit of, in the second part of the book, when you talk about exploring different forms and flipping it around and looping through the data, I did, like, five or six different maps of what the book looked like to me. And then I realized that the order craft bias data is not parallel. So it starts in the first half, craft, bias, data, and then it goes, data, bias, craft. And I had this idea to include the meta formap, which you introduced, which is a fun chart form I hadn’t really thought of. And I was like, it’s like a road that you sort of turn around and end up where you started. So we’ll put these visuals in the show notes if we include this section.
CC: This is the coolest thing I’ve ever seen.
CM: Is it weird to see how someone else interprets something, you know, very familiarly?
CC: Oh, it’s incredible.
CM: Tell me about it.
CC: This is one of those moments, right, where I’m so appreciative that you did this. I feel like this is the present.
CM: Feel free to use these in any way. I could go for ten more hours. I just tell myself, it was like 10:00 at night, and I was like, I could do 100 more of these. And I just learned so much about the book in the process of creating these.
CC: I just love it. Well, I mean, that’s the beauty of mapping, right? You actually mapped this out and discovered new things while doing it. Right. Which is exactly what the book is trying to show. So I feel like you’ve hit on something here, and I think you’re right with the u-turn. I’m looking at this last one with the metaphor, the three main elements of the book that talk about craft, bias, and data. That was very intentional that it’s a mirror image in the section of the deconstruction, then the construction.
CM: At first, I was like, “Did I catch a mistake?”
CC: No!
CM: But then I thought about it. So what drove or led to that intention or decision?
CC: So the first half of the book, right, is about deconstructing maps and infographics. The second part is about building them, constructing them. So in the deconstruction, if you are looking at an infographic made by someone else, you often do notice the visuals first, right? So starting with craft felt like that accessible way in for people.
CM: Right. Because you’re immediately having a reaction to what you see in terms of color, font, all that aesthetic. And then, you can engage with the content.
CC: Exactly, right? Then it’s about the bias, the stories, the agendas there. We’re building intrigue, too, if you’re thinking of the murder mystery that’s paralleling it, hitting data as the third element there. Data has become such a loaded word, right?
CM: Yes.
CC: It’s like the new name dropping is like, “Oh, my data is so big.” This is about not over-indexing on data. It’s a component here, a very, very important one. Right. But let’s not pretend it’s everything. It’s one of three things.
CM: I really love that and something that, again, came up in our book club, I’ll call it, discussion, is how much we all appreciated the level playing field all three of those things were treated with. And the fact that bias is just acknowledged almost like in a neutral way, like I’m saying, that bias wasn’t treated as something that was inherently bad. It’s just going to be there no matter what. And so we have to acknowledge it and work with it and recognize it when we’re viewing it and acknowledge it when we’re creating things. I have one final process or philosophical question before diving into the content, and that’s sort of around this idea of humanity. You’re intentionally making space for emotional experience and embodied knowledge in this work and not discounting them. And there’s a couple of places where this really stood out to me, I think. There’s this tool on page 29 called which, why, and how. So if you’re deconstructing a visualization or a map and you’re looking at it asking the questions, “Which emotions? Why those feelings?” And, “How are they evoking those feelings from me as the creator?” There’s a couple example maps in there, one of which is anchored in the senses as they’re tied to the seasons. A personal depiction of an ephemeral scene of the woods. It just makes me think of, I don’t know if you’ve heard this concept of multiple ways of knowing, but as a society, we’re sort of over-indexed on generalized knowing, which is sort of rooted in measurable data and kind of marginalizes other truths that people bring from their embodied experience or artistic knowing or practical knowing.
CC: That’s exactly it. Right? Again, you put it really elegantly, and I love how you put it that way because I would have never expressed it in that way. When you look at any kind of data visualization, you’re going to have a whole range of emotions for a lot of different reasons. And that deconstruction technique that you just described is meant to allow you to unpack each of them and be able to articulate where they’re coming from, what happened to cause you to have that reaction. Because what they put in the world, that’s only half of it. Right? It’s how you receive it that’s the other half of it. I mean, and, actually, we use that technique in class a lot, not only when viewing infographics that are out in the world and being able to make sense of what’s going on with them, but as a critique tool for each other. As they’re making their own work, then that gives students a vocabulary to be able to talk about, well, this is what I’m feeling when I look at your piece, and this is why I’m feeling it. It’s because you’ve done this thing. It’s because of something that you’ve done with the data, or it’s because of how your craft is coming together, or it’s because it’s not clear what your agenda is here and it’s landing flat because I don’t get the point. Right. It allows them to be able to identify what’s working and improve on it, right? Like be able to talk about specific ways to take their work further.
CM: I think we can finally dive into the content of the book, because we’ve already been doing that a bit. Quite a bit. So this is my– in the outline, I’m calling this nerding out and digesting some of the really fun details that are in this book. So as we mentioned, the first half is all about deconstructing maps. It’s woven with this murder mystery where we are collecting these visual artifacts and using them as clues and interrogating them from different perspectives, which the organizing principle is the data perspective, the craft perspective, and the bias perspective. Starting with craft, we can look at this. I think maybe it would be fun to have you read a little bit. Do you have your book?
CC: Sure.
CM: Yeah. Let’s start with page 28, the first paragraph under Methodical Destruction.
CC: Yes. Okay. When you’re in grade school and want to get a message to a friend across the room, you put that message on a piece of paper, fold it up, and pass it over. That folded note is the vessel that contains your message. With maps, the vessel is craft. Craft is the skin on your data, the house for your frameworks, the frontwoman for your big ideas. If you’re the map maker, craft is the filter that everything you want to say must pass through. If you’re the viewer, craft is how you orient yourself to understand and react to a map. We all judge maps based on their craft. It helps convey and expose biases. Intentional craft can make a dense topic float. Sloppy craft can muddy strong points. Craft is hard to do well. An experienced map maker might pull the levers of crafts so expertly that every last decision is intentional and has a purpose. A novice might rely on a generic computer program to output a chart in boring computer blue because they haven’t changed the default. Viewers don’t know the difference between intention and default.
CM: I love that. The viewers don’t know the difference between intention and default. I was going to have you stop a little bit earlier, but I’m glad we got all the way to that sentence. It really goes back to what you were talking about in terms of choosing the order in which craft, then bias, and then data, I think, for this first section are ordered. We see with our eyes first. We take in the obvious visual encoding choices, but a lot of times people forget that those are choices and need to spend time intentionally choosing color and other form material. You have this whole list of raw materials that is really helpful to remember. What feels important to talk about when it comes to this section about craft?
CC: I think a lot of people get intimidated that they’re not graphic artists. Right. I think I will often get a question of, what fancy program do I need to be able to make my visualization? I’m sure you get that question all the time. And–
CM: I’m like, “It’s called a pencil.”
CC: Exactly. Right. You can take photographs of something and use that as your texture or just draw it out. You don’t need anything fancier than gorgeous visuals and keynote. So it’s really about the basics, and pick one element of craft to be intentional about as a way to start and that will take you so far.
CM: I really like the idea, the invitation to just pick one element and start from there, and also the invitation to use your hand. The soapbox that I continually stand on is like, if we’re starting within the menu of options within Excel or any other chart-making tool, we’re not going to have anything interesting to say.
CC: No. In the same way that we’re talking about drawing the craft piece by hand, you also brought that to moving your data around by hand. And that’s something that I feel strongly about, too. Even if your data is embedded in some huge database or Excel table and there’s a lot of rows of it, find a way to get it off screen and do some distributive cognition, like move it around on the table. It’s a different way of thinking. Like, we think we can do those operations in our head and we just can’t.
CM: No, I talked about this with Ross a while ago. There’s some level of intimacy that you achieve when you’re manipulating it by hand and familiarity that you get with the data. And you can even do this with “big data” if you’re just like imagining the shape in general of it that I think people forget or don’t even think to try.
CC: Yeah, right. It’s almost how you give them an invitation in to know that they can try.
CM: Yeah, well, my invitation in, which sort of kind of falls very well in line with the second half of the book, is sometimes I do with clients what I call a shitty first draft workshop, where we know a general shape of the data. We know perhaps a potential story that we want to tell with it, and we’re trying to ideate on the form that we want to use to tell that story. And so we’ll just set a timer and everyone works individually, and then we sort of present all of the sketch ideas that people come up with. And calling them shitty gives people permission to just play and try and not judge it too harshly. And then, using your hands also helps you get familiar.
CC: Those constraints, right, that make it impossible to be perfect is what you’re saying. Right?
CM: Yes. Exactly.
CC: But they’re so freeing. They are absolutely freeing.
CM: There’s so much more I could ask about craft, but maybe we’ll move on to bias. I really love the concept of bias clouds. And again, appreciating the neutrality of how you discuss bias, that it’s just natural and unavoidable and important to be aware of and acknowledge and also consider the harm. And I guess that’s like the three-way continuum. What would you call the bias cloud based framework?
CC: Well, now I’m going to call it a three-way. It’s the bias cloud three-way. Yeah, it’s three continua that kind of meet in the middle.
CM: Why don’t we go to page 56 and I’ll have you read the first paragraph, Undermine the Message.
CC: There’s an ambiguous force at play in every map. It can feel like an unease in the center of the chest, what’s included and what isn’t? How is it depicted, taken in? Is it useful, enlightening, dangerous, or empowering? This force is bias. Your bias is your preference. It’s your intuition. It’s shaped by your perspective. It’s born from your culture, your lived experiences, and your current context. Your bias is the lens through which you view the world. Sometimes that lens is sharp, other times it’s blurry. But you and me, odds are we don’t wear the same prescription.
CM: I really love, again, acknowledgement of the embodied experiences of this and what it feels like when you’re taking in the bias in a chart or just noting that you might actually feel something physically while absorbing the creation of another person. And there’s a message in that and an agenda, perhaps, to interrogate.
CC: Absolutely, right? And there’s always an agenda, is part of how I feel too. Right. Whether or not the person that created it did that intentionally. There’s an agenda there. And so that’s why being mindful of when you’re the map maker, be mindful of the decisions that you make, because they do have consequences.
CM: Yeah. This is an underlying theme of a lot of conversations I’ve been having, is placed within the greater cultural context of where we find ourselves today in society. And sort of this post-truth, almost era. You talked about data literacy, but I like the way that bias is addressed here as just like an invitation to ask questions and connect with your own bias and the creator’s intent and their bias and acknowledging that we all have different perspectives. And what about today’s context made this feel important to bring into this book as a major tenant of maps?
CC: Every single map has an agenda to it. And that agenda ranges from things that are quite benign. Like, “I’d love to invite you in to explore this topic,” but then move up to increasing intensity of like, “I have a point I want to make.” I’m making this point with this infographic, to revealing something like, “Tada, you never thought of this topic in this way. And the infographic that I’ve made has now opened that up for you.” All the way up to the most manipulative of when somebody makes a infographic whose intent is to manipulate, or maybe it’s not, but because it’s done so poorly, it manipulates people’s ideas. And our current global context is one where misinformation is everywhere. And that means that data literacy is even more important for all of us, right? No matter our level of expertise and what that misinformation can be about, right. It’s anything. It’s absolutely anything. But we need all of– it’s all of our responsibility to be well-informed viewers of the many formats of data story that are out there.
CM: As someone who’s working with youthful people, do you have hope in this regard? Like, I’m just feeling a little bit hopeless.
CC: So much hope. You should see the incredible work that these students make. I mean–
CM: Oh, good.
CC: We’re nothing without them. I don’t want to talk like I’m an old lady. I’m so not old. I was about to say, these youth–
CM: These kids.
CC: These are some hard times, right? And they’re hitting different people in a lot of different ways based on race, demographics, gender, sexual orientation, right. Everything. It is hard to be a human in the United States, around the world, and a lot of people, we’re all trying to make sense of what’s happening, right? And making sense with visual stories, with data stories, is one way. And if my tiny slice, my tiny contribution, is about helping students get better at that, then I feel good about that. But there’s a lot of talent out there.
CM: Oh, I’m so glad to hear it. I guess I’m always fighting my desire to trust everyone and everything around me and be more skeptical and bring in that critical eye of acknowledging or recognizing the bias, in especially the things that I’m wired to agree with and interrogate those in the same way I would things that aren’t in my political purview.
CC: It’s hard, isn’t it? Right?
CM: It is.
CC: It’s hard and it’s exhausting.
CM: Indeed. There’s still one more aspect of the data. We’ll go to page 77. So the section where we’re talking about, what is this D-word?
CC: I loved calling it the D-word. Data. Finally, the meat of the map. Vegetarians welcome. There is often a tendency to rush into the data. It’s important. Yes. Data is your raw material. It’s the information that is sought, molded, stretched, and reconstituted into what becomes the map. Without data, there is nothing to make a map about. But data is jello. It’s quite easy to give it any shape or flavor, and it’ll look good on the plate. Tada, it might even be delicious. At the risk of pushing that metaphor too far, a great tasting, intricate looking jello mold isn’t necessarily good for you. The same holds true for maps and infographics. Enjoy the data. But don’t be fooled. When deconstructing a map through the lens of data, remember that it is inextricable from bias and craft. What does the data say? Trick question. Don’t ask the data. It can’t talk. People are the talkers. Instead, ask, what does the creator of this map want the data to mean? Or what does the creator of this map think this data can show us? This slight reframing can help keep bias and craft top of mind. Even the simplest data set will be interpreted differently by two different creators.
CM: So if you have ever said, the data speaks for itself – I’m talking to the audience listening here – consider what Carissa just said and read from her book. Don’t ask the data. It can’t talk. It can’t speak for itself. And you have to acknowledge that. I think Ross and I both were very, like, highlight, exclamation point, underline that section. Yeah. Have you come across– what has informed this perspective for you? Where have you come across this in your work?
CC: I think it’s about the– there’s a section in here about the boundaries of data sets. And when you think about any data set, there’s a place where it starts and stops and somebody decided, here’s all of the parameters that we’re going to collect about a certain topic. Here’s how long we’re going to collect information for. Somebody made that decision. The example that’s in here is if I said, “Hey, Catherine, how many dollars are in your pocket?”
CM: Zero dollars.
CC: Zero dollars. Right. And that may mean, literally, you have no bills in your pocket, but I guess you might have a credit card in the room, and that credit card might have the ability to make purchases on it, like a credit limit or even a balance. Right. But if I say, how many dollars are in your pocket, you could expand that, and what is the collective sum that you’ll be able to draw against this year? If you have a mortgage, are you trying to pay that down? When I say dollars, that’s not clear-cut. Right. And when I talk this out, right, it might make sense, but when you look at just a row, a column in a data set that has a value and a label, we tend to put just one word at the top. Right. Like value or amount. But that’s my definition of that. Right. That’s the creator’s definition of it. And this all comes from, again, bringing the human and their decisions into what was included in the data. And also seeing, a lot of times people will just go grab whatever data set is available and be like, this is what it is. And what isn’t included is almost equally as interesting as what is included.
CM: Yeah, and as someone– I mean, it’s not my inclination to dive into the methodologies and learn about these things. I’m increasingly understanding the importance of doing so and building that into my practice, especially if I’m going to be working with and communicating data that is informing big decisions and is not just like made up by me. I need to understand who created it and what decisions they made along the way and who’s paying for this data and who’s profiting off this data and all that. Because it really does create a full picture. Instead of just being like, this is the truth, here it is, it speaks for itself.
CC: Right? I mean, we all have constraints to projects. That’s totally understandable, right?
CM: Exactly.
CC: You had enough money to collect data from these three towns, but not this next one down. But that doesn’t mean that the data you have then speaks for everyone, right? No. It speaks to what you collected for. So articulating what constraints you had and being transparent with that. That’s kind of the next nudge.
CM: All of those quotes I had you read were encapsulated in sort of the first half of the book, and then we weave our way back around into the creation of a map itself. So I don’t think we’ll go through each craft, data, and bias individually this time. But I do want to talk about this continuum you have that I have used repeatedly with clients that on the left side it says explore, and on the right side it says explain. And I use this all the time with clients when we’re sort of iterating through, number one, what is there that’s interesting in the data? And presenting it in a way that inspires you to ask more questions and get more data and sort of like loop through it. I think that was a term you used. Something that I haven’t thought about is how there is sort of like a natural move from left to right. So you get ideas, you’re questioning the data, you’re trying to make sense of things and reorganizing it, and gradually you’re working your way over to deciding what you want to communicate from that and deciding how you want to communicate that. This explore before you explain, I’ve seen it in other places, but as I’m hearing you talk about it, it seems like this might be one of those things where you arrived at it organically and then realized that–
CC: Oh, totally. Totally, right?
CM: –it’s also another discovery that’s in parallel with other people.
CC: In the design world, right? We talk about prototyping, right? If you’re a writer, you talk about making rough drafts, right? It’s just another way of saying that same thing, that no matter what discipline you’re in, you have that way that you talk about, how do you try things before you know what the right thing is to do? And it can be intimidating if you’re not somebody that makes a lot of infographics, but just knowing like, “Oh, I can do this little exploration first before I need to have this grand vision in my head as to where it’s going.” Hopefully that allows people to find their way in.
CM: Yeah. One of my other favorite quotes in this Creating a Map section is on page 139. It’s about getting the hand moving in order to get your brain grooving. I just really love that, the truth in that, especially if you’re feeling stuck just starting somewhere. And making it a small goal. Where did your love for this hand exploration come from?
CC: I mean, I think that’s probably the designer side of me, where there’s a lot of sketching of the first ideas of trying to figure out how to move information around. I’ve always been interested in synthesis and finding patterns and anything, like any kind of information. I’ll share my favorite in-class exercise that gets the hand moving is called salad mapping. And–
CM: Oh, I read about that.
CC: Yeah, it’s not in the book. It didn’t make the book, but essentially get like a Trader Joe’s type prepackaged salad for everybody, where it’s like, okay, you get the whatever Southwest or the Cob, everybody gets a salad, and that salad is your data set. And then they’re like, “That’s a data set.” And yeah, it is. Right? And so everybody dumps their data set, their salad, on the table, and you start to look at what’s in there. And then we say, okay, if you have to find a continuum in this salad and literally make it out of the salad, like, what do you see? And so using those salad ingredients, they’ll arrange them along a line of lightest in color to darkest in color, or number of ingredients, like high number to low number of these ingredients in here, but then also qualitative things like, things I love to eat, the things I don’t like to eat. And then it gets way more and more interesting, and you have them do that with a continuum. And then you say, okay, same data set. Now you have to look at it through the lens of amorphous Venn diagram, right, where we’re looking at what are the ways, what are the interesting connections here? Now you have to look at it through a powers of 10 type scale shift or zooming way out or zooming way in.
CM: I love this activity.
CC: It’s really fun to do because there’s an aha in there for everyone, right. And because you’re not making anybody draw, you’re actually using the materiality of the salad, that shows the power of moving things around without that drawing barrier getting in the way.
CM: Yeah, hand is still moving and still getting the brain grooving.
CC: Totally.
CM: As you’re describing it. I’m like, as an instructor, I’m so curious. How did you get the idea to make that an activity? Where did that come from? It’s genius.
CC: Every once in a while, you have one of those moments.
CM: “This could work.”
CC: Yeah, I mean, I think it’s like a great warm up before you’re in with the topics that are really heavy. The ones that you want to make the visualizations of are often quite deep, and if they’re about a great world issue that’s going on, that stuff is really heavy. It’s all about isolating what you want somebody to learn. And with that, it’s like, oh, wow. When I consider a salad, here’s all these ways to look at it that I never would have thought of before. And so it really gives that realization that there’s so much more than what our own assumptions are of that thing once you start to really get into it with the maps.
CM: As we’re talking about this, I’m reflecting on the fact that the d.school is really interdisciplinary, right? It’s not like only designers end up in courses at the d.school. So have you seen folks go on to be map makers or information designers, or are they all just endeavoring into different industries and careers?
CC: Well, most of our students, like you say, are from an entirely different discipline. And my greatest hope is that you pull something from your design experience. For those students that are going back to be doctors, that are going back to be teachers, that are going to be lawyers, et cetera, right, that they pull something that they’ve learned into their own practice. I love when students, years later, will share like, “I still remember this thing that we did in class, and look what I made.” I love when students share work back. So that’s always like– that’s the thing that makes it really fulfilling and always grateful to people when they do share.
CM: So we’re going to try and wrap this up.
CC: Okay.
CM: Ooh. I have a lightning round if you’re willing to do it.
CC: Okay, great. I love lightning rounds.
CM: First one is a challenge from the lead cartographer at Stamen, Allen. Rank these three things on a continuum of mappiness, not map to most map-like.
CC: Okay.
CM: First one is a satellite image, a Monopoly game board, and a Venn diagram.
CC: Not a map is the satellite image. And then, in the middle, I will put the Monopoly board, and then I’ll make the Venn diagram the most mappy. But it was like, I had to think about those last two.
CM: Yeah. I’m tempted to ask you more, but since we’re in a lightning route, I’ll just keep going because, whatever. Can you think of a map and a quick hit story of one that carries either sentimental or nostalgic value to you?
CC: Oh, I once made a map that I’m pretty proud of. I sliced up 66 pairs of my own shoes, and I set them in resin. Right, so you’re looking at these kind of circle cut outs of your shoes, and then I stacked them like a Stratigraphic section with rocks and geology, where you look at the layers and the pebbles are indicated or tilted in different ways. It was like, 8 feet tall, and this kind of represented a slice of my life when I had those pairs of shoes. I feel like that really embodied me more than anything else.
CM: What did you learn about Carissa? Or what did people learn about Carissa when they looked at that?
CC: Well, I kind of measure my experiences with footwear sometimes, too. You need the right pair of shoes for every moment. So I remember things based on how the ground felt and what I was wearing and so cutting those felt like kind of like breaking something sacred. But then also you’re looking at it in a new way and exposing that about yourself. Maybe there’s like a little bit of that awkwardness in there.
CM: Yes. Okay. And then, last one is three things that you’ve learned or however many you can think of from your practice of taking a daily photo at 6:06.
CC: Oh, 6:06. Okay. My most favorite, my longest running activity, 6:06. Wow. Your life can flip on its head in a year and it’s impossible to predict it. Too, it’s fascinating to look at like the meta cycles of your life. Now I’ve done this for almost twelve years now. Right. So in the same way that we orbit around the sun but then there’s also eccentricity to that orbit, there’s just waves of time when I am doing different activities and the season of that activity goes away. So it’s like larger scale patterns to see. And then, the third might be – I don’t know – it’s fascinating like how many times you’re in an elevator or insert whatever other random occurrence that you would have never thought to notice about yourself.
CM: Well, this has been such a fun conversation and I’m so glad we were able to find the time and–
CC: It has.
CM: –connect about your amazing book. I really enjoyed reading it first time in one sitting, and I think it’s something that’s going to just stay out on my desk and I’m going to continue to reference.
CC: Or your bedside table.
CM: Yes. As you imagined.
CC: No, thank you. Thank you for having me and for your visualizations of it. I am going to go back now and look at those really closely, and I really appreciate that. That’s really one of the coolest things I’ve seen.
CM: Oh. I enjoyed doing it. It was a joy, and I was just applying some of the things you were teaching.
[music]
Thank you for listening to Pollinate. Thanks to Carissa for our conversation today. This episode of Pollinate was written by Allen McConchie, Eric Rodenbeck, Ross Thorn and myself, Catherine Madden. Music for Pollinate was created by Julian Russell. You can find The Secret Language of Maps in bookstores now. And you can see more of Carissa’s work on her website, Snowflyzone.com. If you like the show today, you can help us out by rating, reviewing, and subscribing. If you know someone who might be interested, please share it with them. And if you have any thoughts about the episode, we’d love to hear them. Tweet us at AtStamen using the hashtag PLN8. For a summary and full transcript of today’s conversation, along with some other visual examples we talk about in the episode, check out the blog post at stamen.com/blog.