
Perhaps you’ve noticed over the past decade how that “once in a century” forest fire or hurricane seems to be appearing in the news more often than its name would imply. With temperatures increasing due to climate change, natural disasters are increasing in both frequency and intensity across the world. In these situations, it’s of the utmost importance that first responders can get on the scene to mitigate damage and aid people as efficiently as possible. CrisisReady and DirectRelief aim to do just that by advancing data-driven decision-making in various types of emergencies worldwide, from forest fires in California to the war in Ukraine.
Creating ReadyMapper to map natural disasters
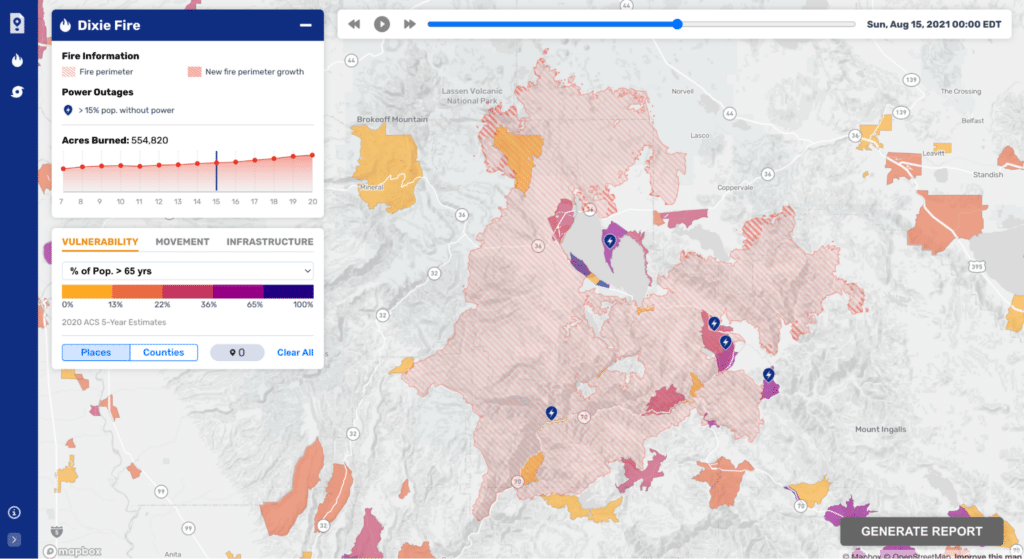
CrisisReady came to Stamen expressing frustration at the multiple platforms required to gather information and make decisions, especially given their need to perform analysis across multiple datasets. We built a tool called ReadyMapper to solve these problems. Initially, it was designed around forest fires so users could answer these questions quickly:
- Where is the fire perimeter?
- How is it changing?
- Where are the vulnerable people?
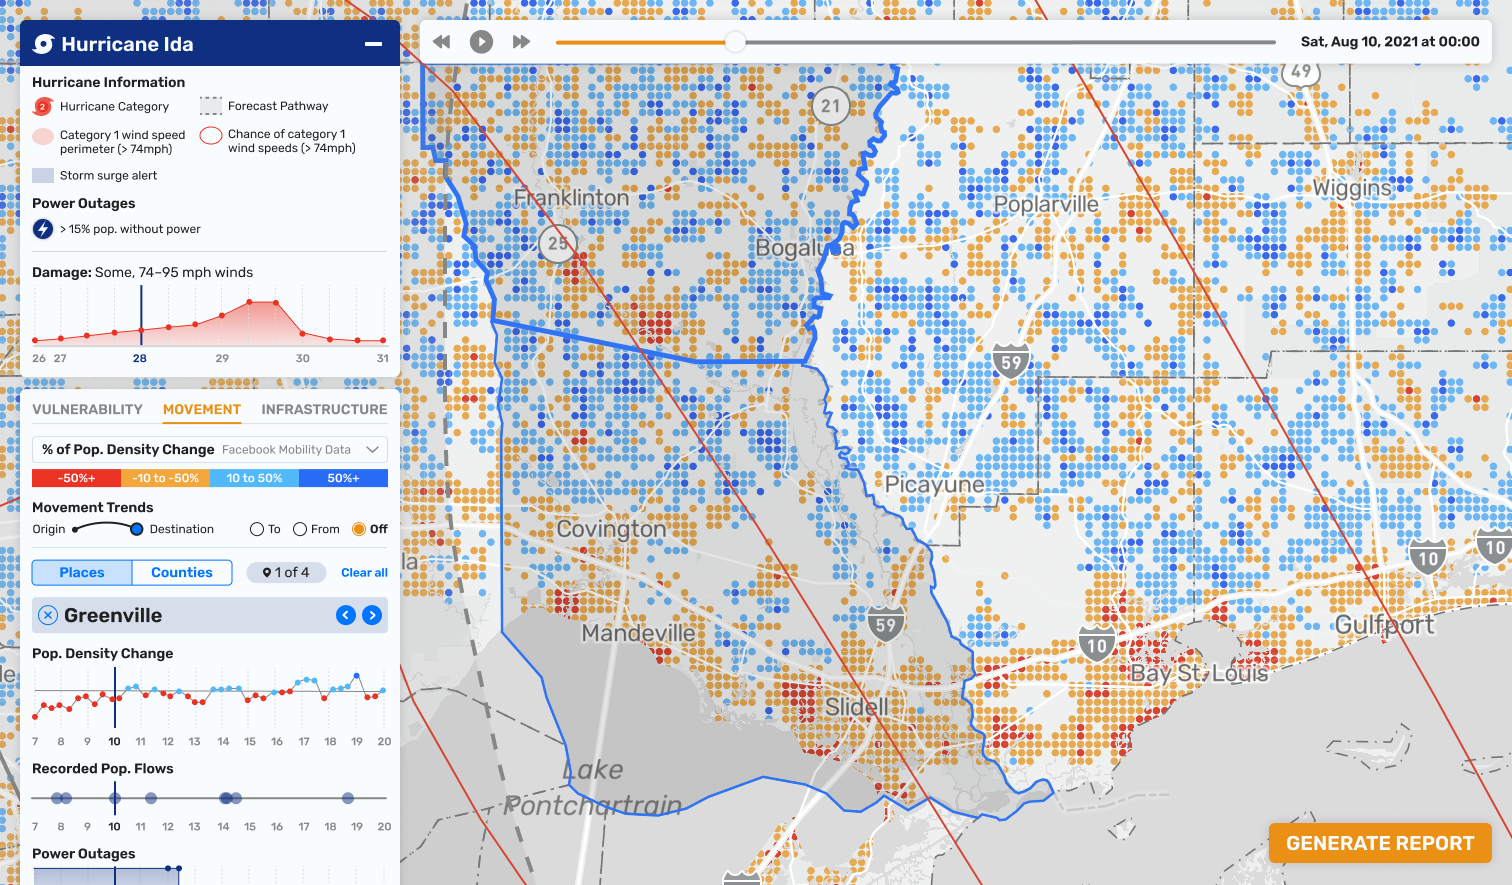
- Where are they going?
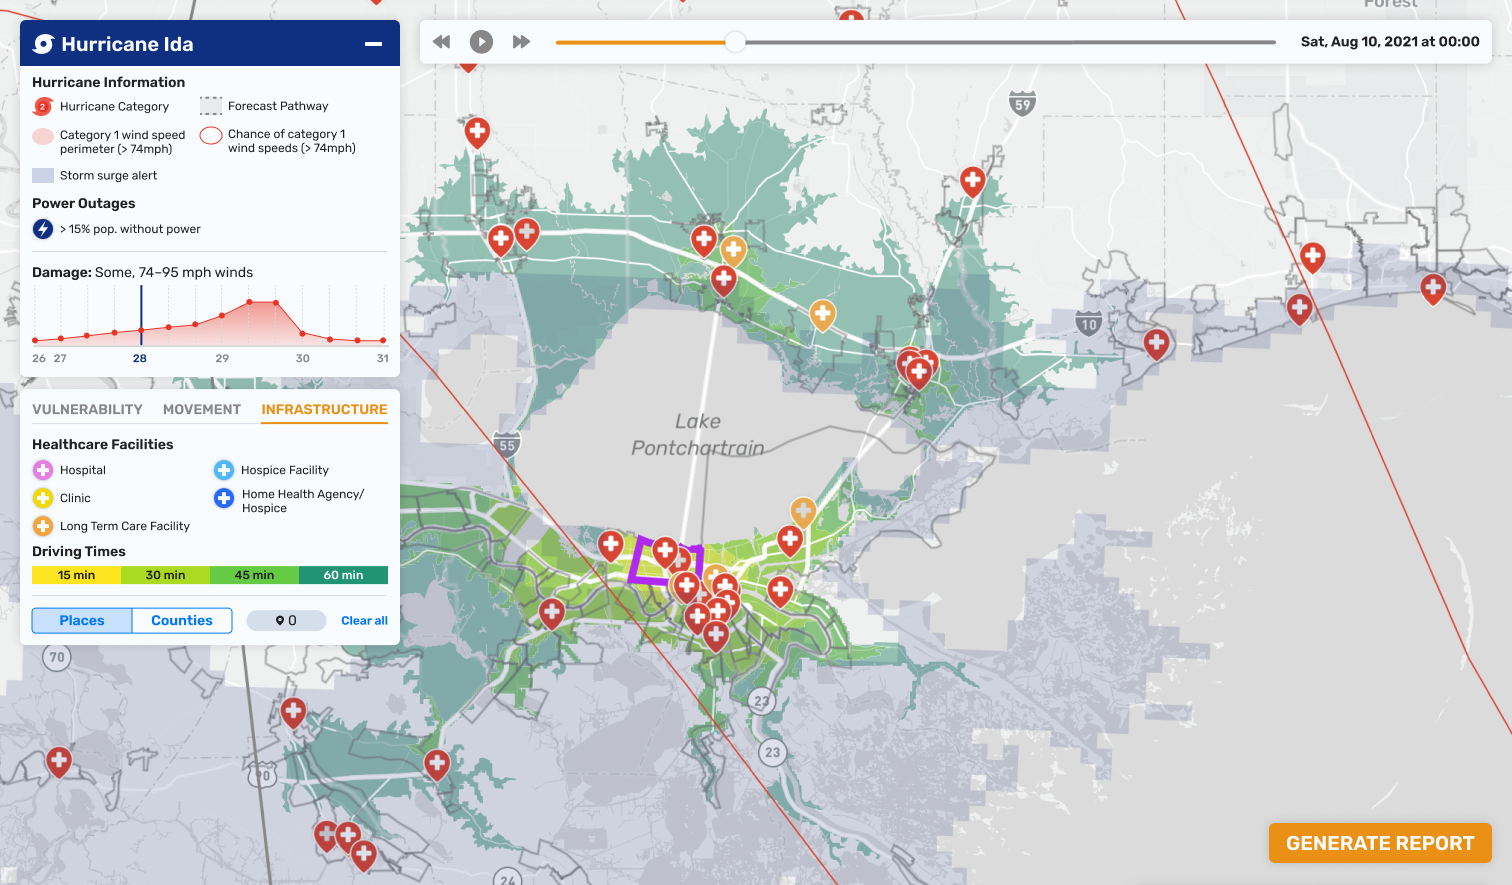
- What does the healthcare infrastructure look like?
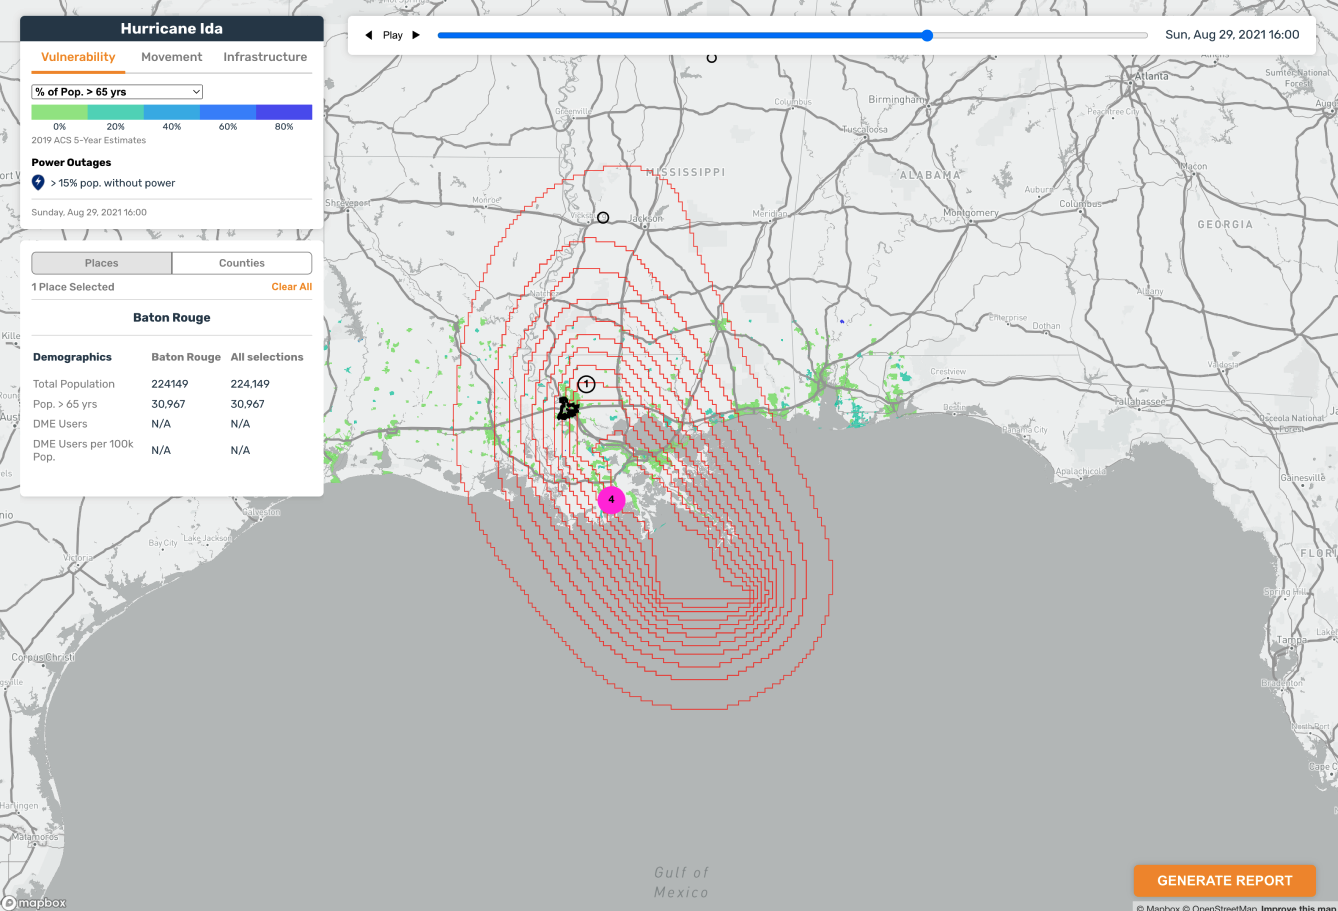
The dashboard features the ability to upload data for natural disasters happening in realtime that can then be visualized alongside demographic data. Users can visualize this information on a map and in secondary visualizations, as well as make selections to hone in on areas of interest. Once they are satisfied with their selections, they can generate a report to summarize their findings for themselves and anyone else in the incident command chain that needs the synthesized results. Users can also upload and/or preserve past fire datasets to study and observe trends for academic purposes and internal training. Learn more about how this dashboard was originally built for forest fires in one of our blog posts from 2023.
How are hurricanes typically visualized?
Once we were satisfied with the design for forest fires, it was time to expand the interface to accommodate hurricane disaster relief. When we were mapping forest fires, we were just showing the fire perimeter along with calling out any new fire growth, meaning there were not many variables to show. Hurricane modeling and predicting is far more robust, however, meaning we had at least 10-20 datasets we could show on a map. Our first instinct was to consult what people were already used to seeing when it came to hurricane visualizations.
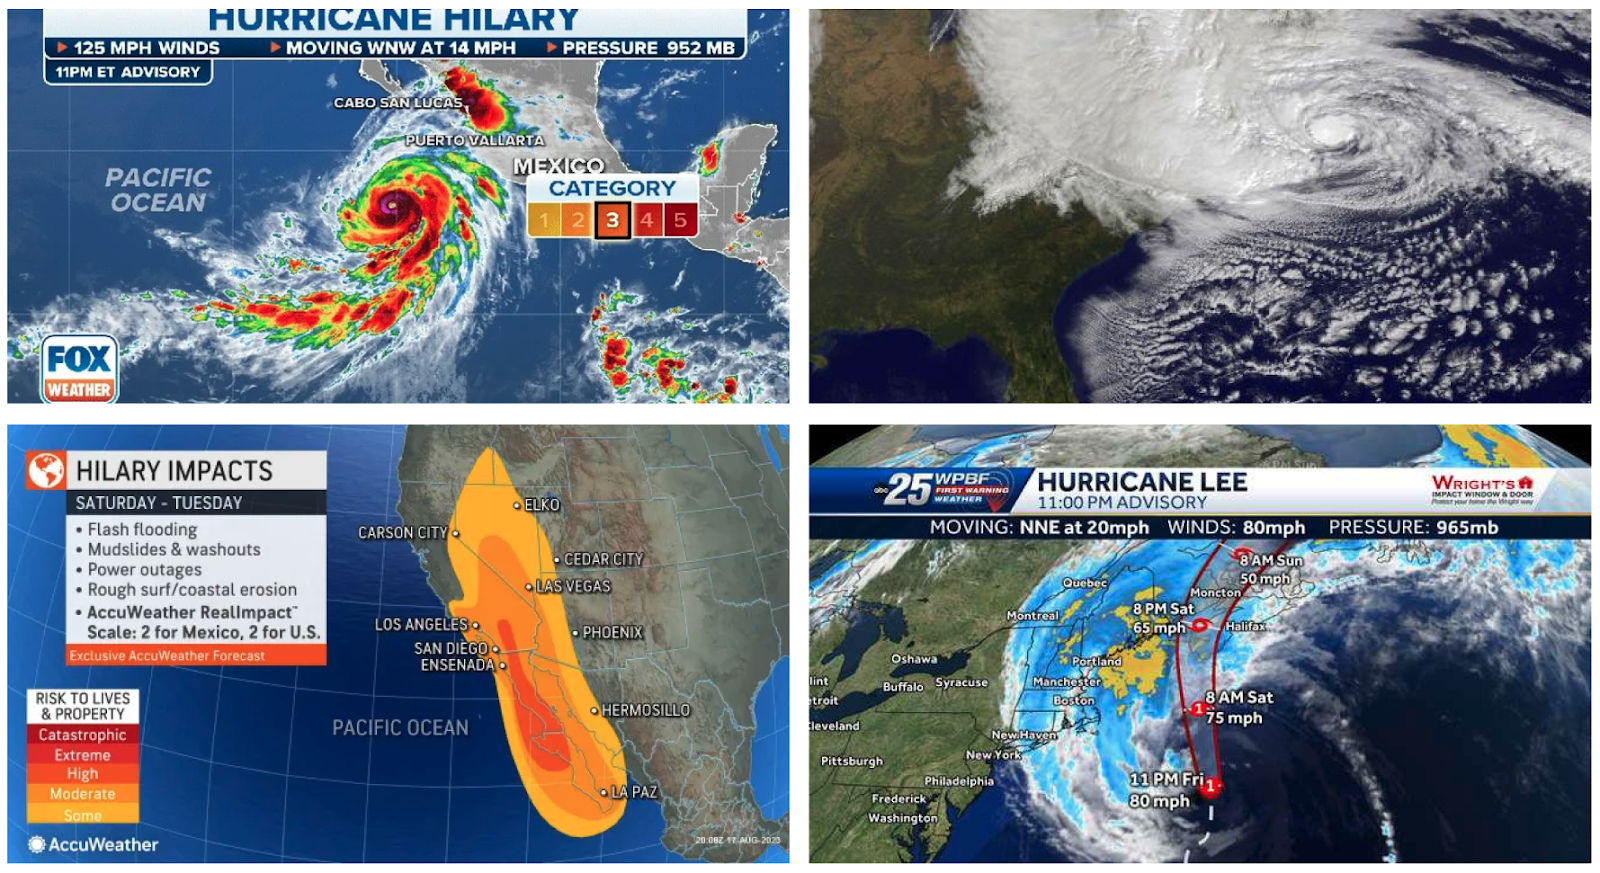
Initially, we were struck by some observations:
- Hurricane visualizations are often at a multi-state (sometimes even country) scale
- The eye of the hurricane and impacted areas are the focal point
- Satellite data is often the canvas for mapping hurricanes
While it might seem lazy at first, sticking to what people are familiar with is often one of the best design strategies one can employ. As Dieter Rams, who founded the Ten Principles of Good Design, puts it, good design “makes a product useful and understandable, is innovative, aesthetic, unobtrusive, honest, long-lasting, thorough to the last detail, environmentally friendly, and involves as little design as possible.” Forcing a user to relearn a system that may not be broken is poor design, so we wanted to maintain as much of these design characteristics as possible.
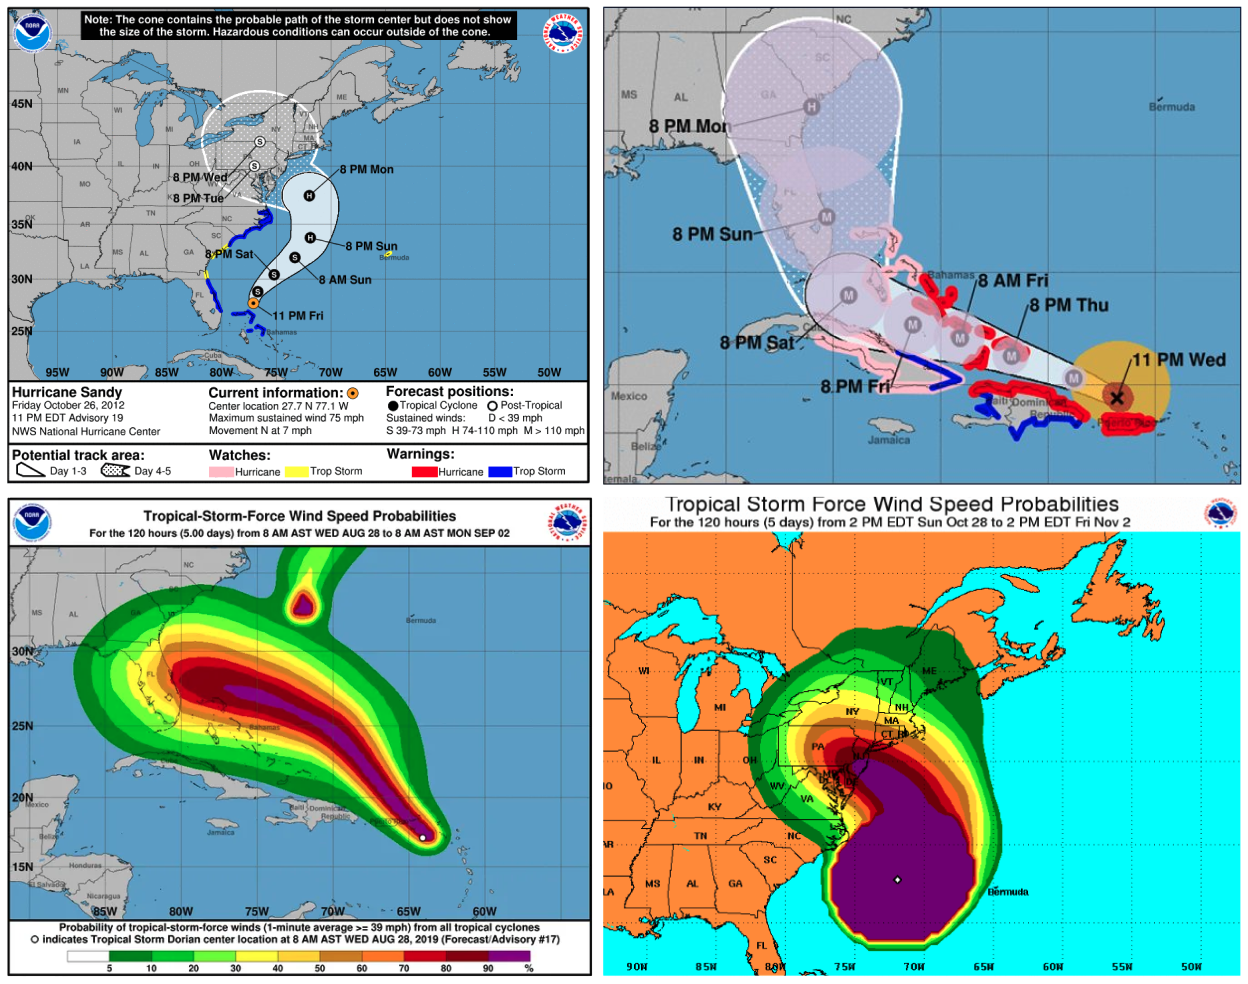
While we appreciated the satellite map as a familiar canvas for people to understand and relate to, we knew it was too noisy to use as our default basemap. Given we needed to also show the other demographic data in tandem with our hurricane information, we needed a much simpler basemap. We did a bit more research on how hurricanes are visualized on monochromatic maps and found that people were often packing in more predictive data. It seemed that the two most common ways of showing forecasting data were through the cone of uncertainty and wind speed probabilities.
Emphasizing wind speed probability data
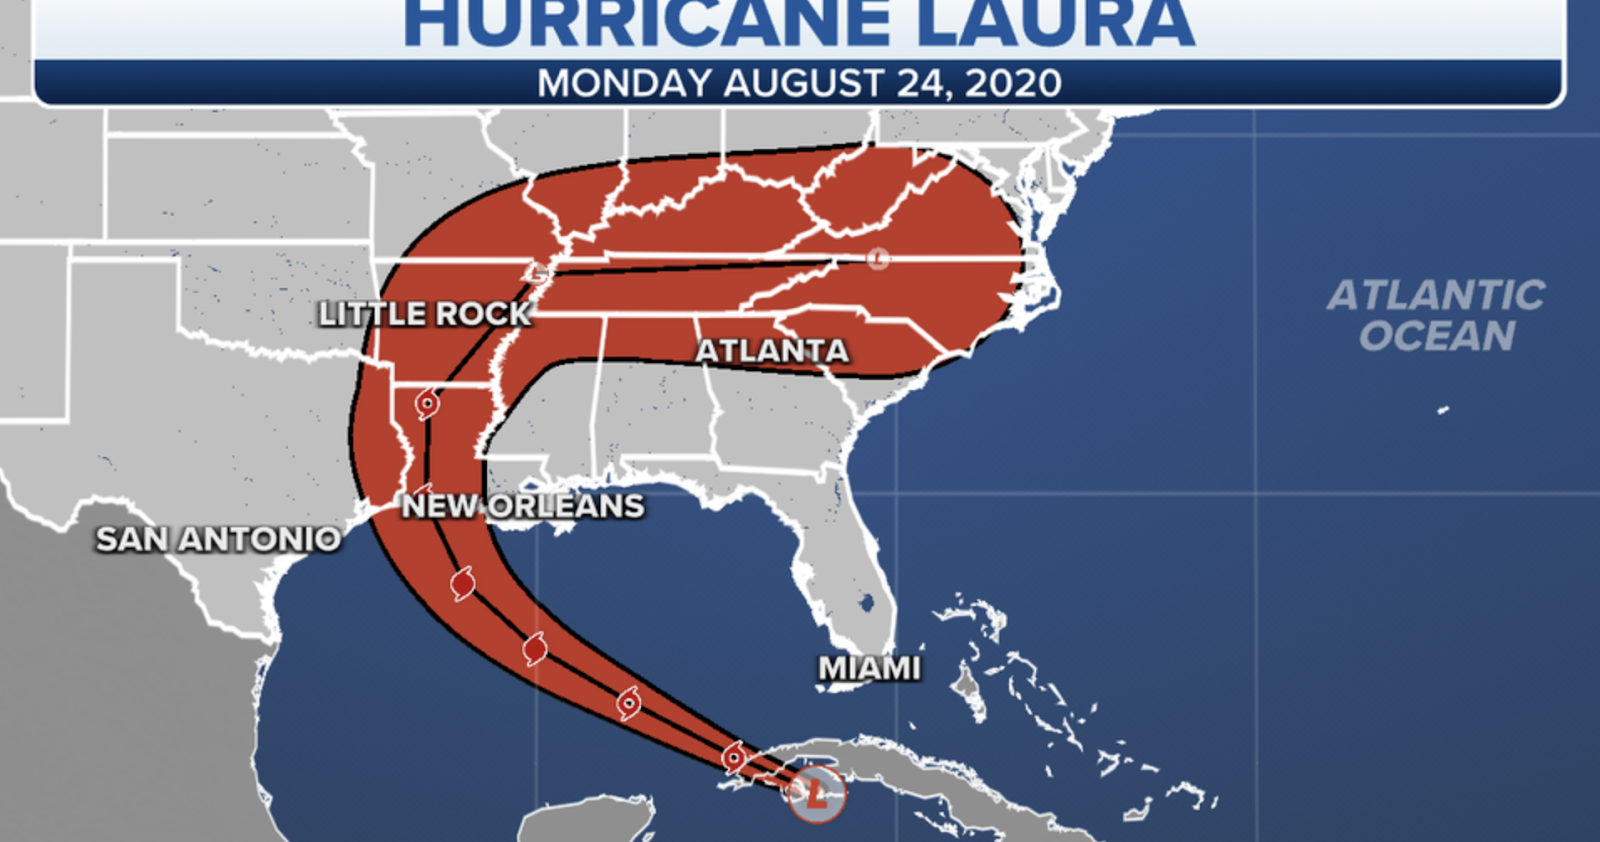
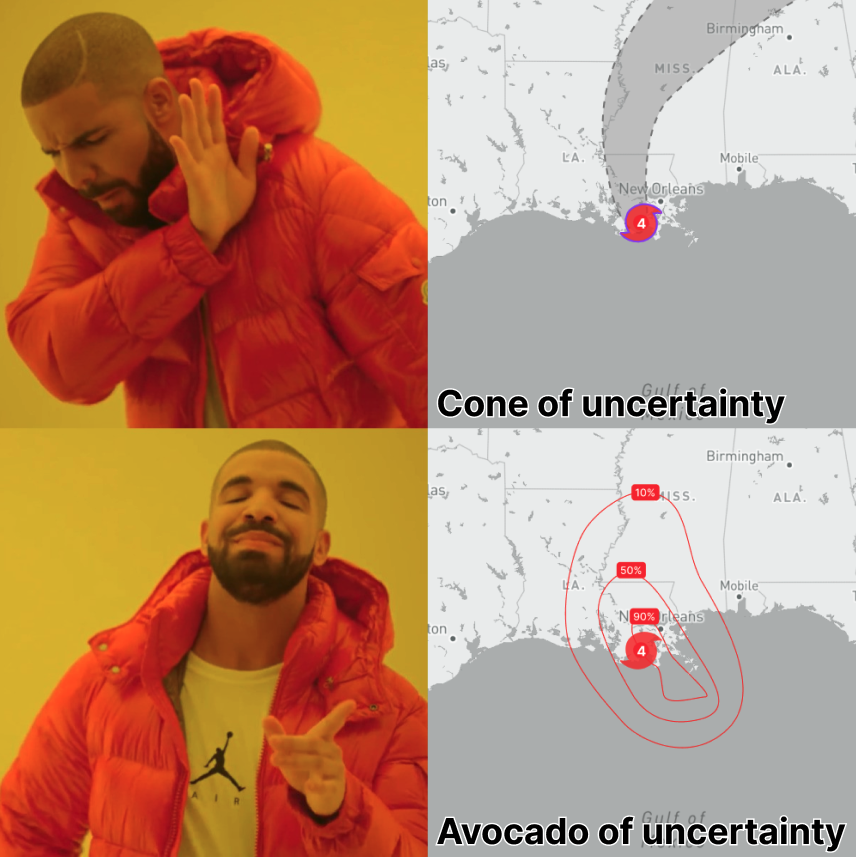
Knowing where the hurricane is likely to go and when allows decision-makers to make preemptive calls to keep people safe, such as determining who to evacuate. The most common way this is done is through the “cone of uncertainty,” which provides a range of where the hurricane could travel. The cone of uncertainty, while commonplace, lacks granular data that is useful for people calling the shots during emergency situations. Through discussing with our stakeholders and future users, we determined that the more precise predictive data would be to show wind speed probabilities.
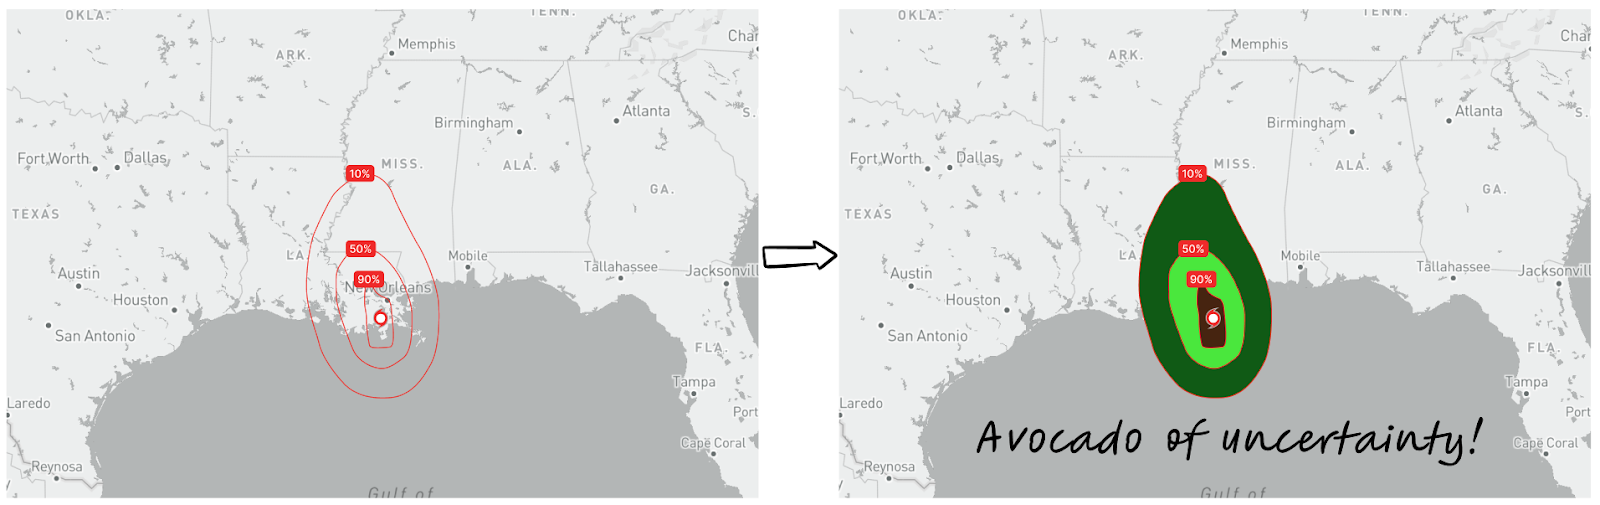
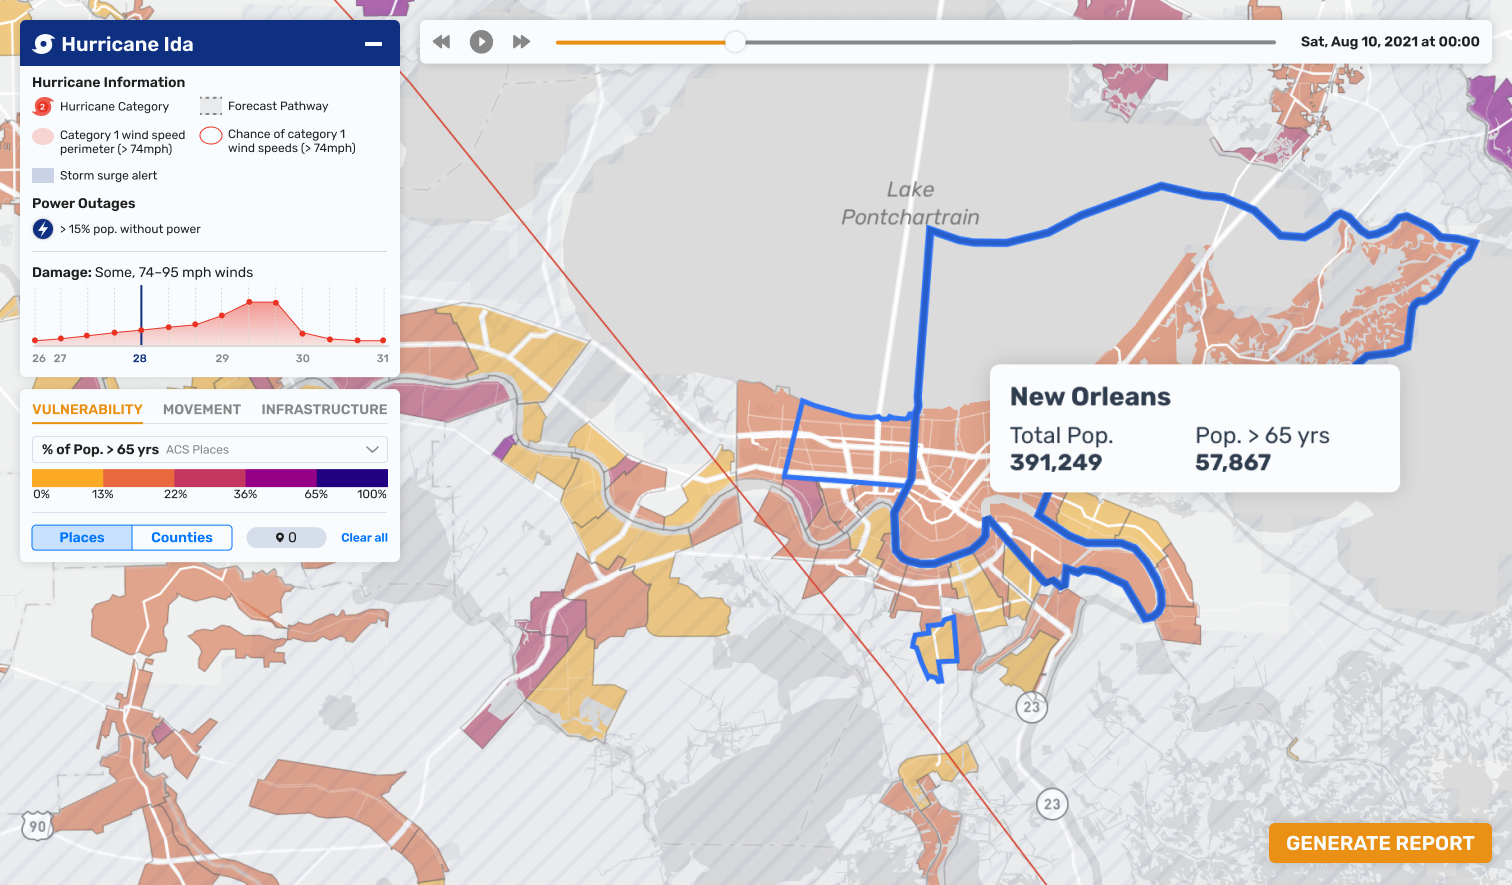
Wind speed probability data shows you the likelihood of sustained wind speeds that denote a category 1 hurricane (74+ mph). The way the data appears on a map is through concentric polygons that denote progressively less likely areas to experience a category 1 hurricane. We had bands showing the breakdown by 10%, but felt that given how much other data we needed to show, paring back the number of circles would be best. We ultimately decided on showing 90%, 50%, and 10% chance areas of category 1 hurricane. The team, and our stakeholders, agreed that this way of showing hurricane forecasting was far more precise than the cone of uncertainty. Wind speed probability data shows specific degrees of hurricane likelihood compared to only emphasizing one area like with the cone. Put simply, the cone of uncertainty tries to do too much at the cost of specificity. When we loaded the data onto our prototype we realized it looked like an avocado; the avocado of uncertainty! Better yet, we realized later that we weren’t the first ones to make this observation.
Choosing the right data for our users
All our forest fire visualizations were done at a large scale that allowed users to view demographic data in tandem with the fire data. Given the speed and severity of hurricanes, we were going to need to design for the big picture at a much smaller scale. This scale is ideal for understanding what the hurricane is doing and determining the larger areas of interest before zooming into the data and showing more granular demographic data. This led us to de-emphasize the demographic data at more zoomed out levels, which meant we could add more hurricane information.
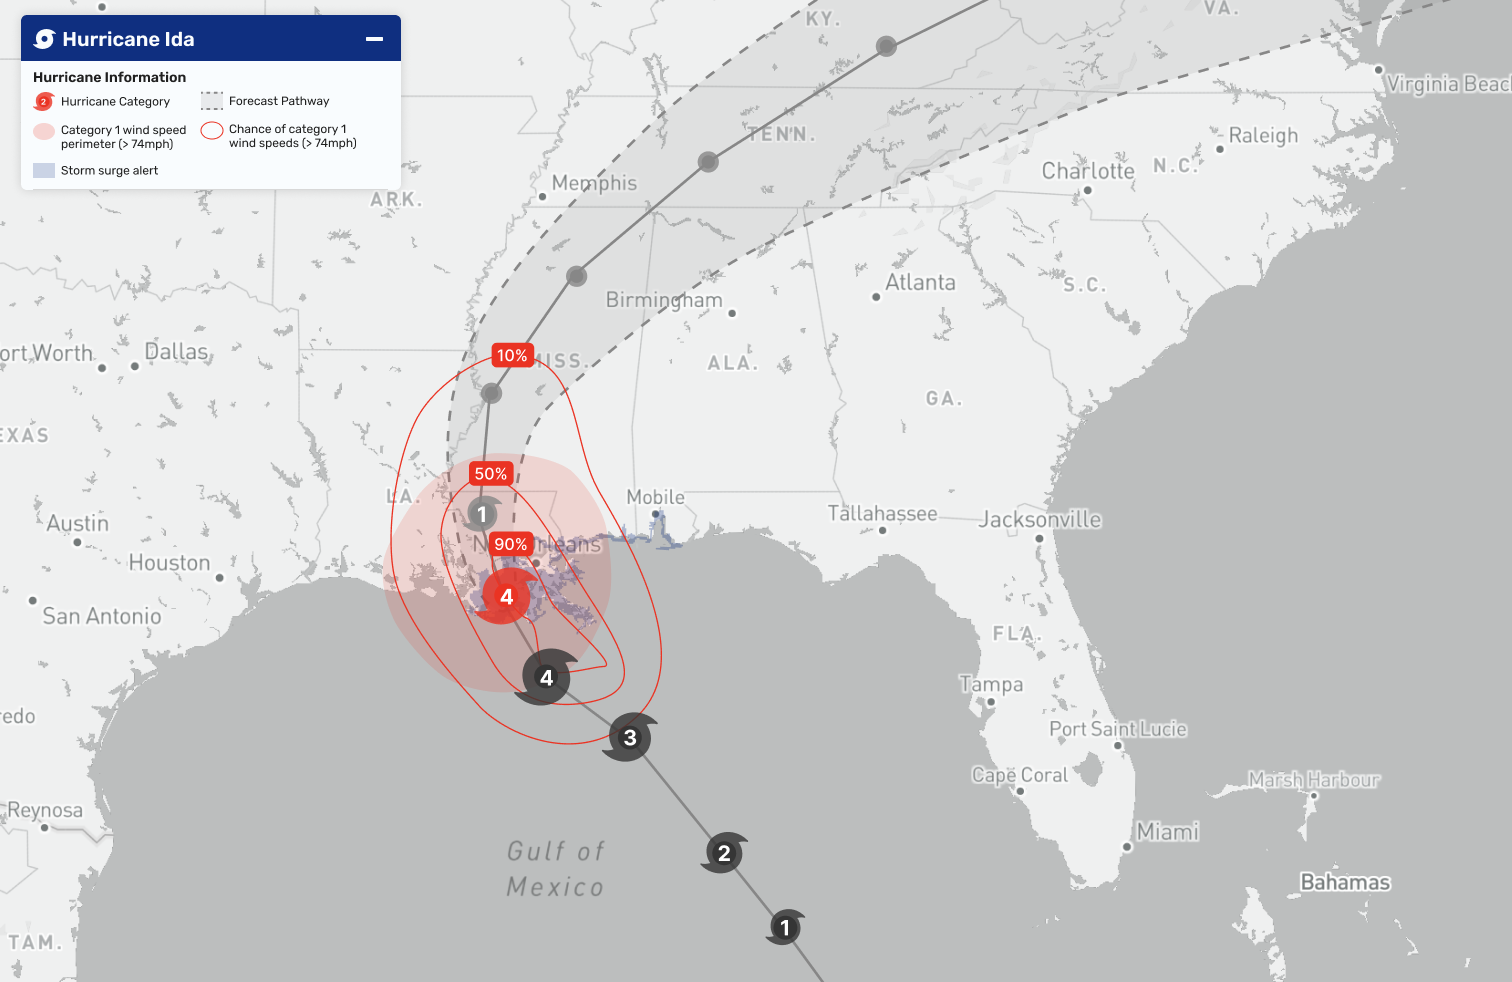
Upon interviewing our users as well as looking at data reliability and accuracy, we decided to add in storm surge data. This would be helpful for users to understand areas that are at risk of flood. We also added in the range of current category 1 hurricane speeds to show the extent of the hurricane impact at that moment in time. We included the historical path as well as the predictive path of the hurricane. For good measure, we added in the cone of uncertainty given how commonplace it is for visualizing hurricanes, though we made sure to de-emphasize that data compared to the rest of our information. As CrisisReady explained to us, people expect to see the cone of uncertainty in hurricane visualizations, though the avocado of uncertainty should remain the focus.
We knew we wanted our focal point to be the current hurricane location and avocado of uncertainty, but we needed to use careful styling that would adjust depending on the zoom emphasis. Unlike most other hurricane maps, our users were going to need to see more of the basemap under the eye of the hurricane. We decided on red to showcase the most important information about the hurricane at that moment in time. We used black to show the historical path and gray to indicate the forecasted path. It felt natural to use blue for storm surge data. With a light pattern, it also could stand out behind the red data overlay that would often appear on top of it.
Designing for decision-making
When a user gets a closer look at their areas of interest, we switch the emphasis to the demographic data by de-saturating the hurricane layers. Users can zoom in and out as well as make selections to see more secondary visualizations relating to vulnerability, movement, healthcare infrastructure, and drive times. We’ve also added an area chart to track a hurricane’s growth by wind over time. Users can move back and forward in time depending on data availability to see change over time.
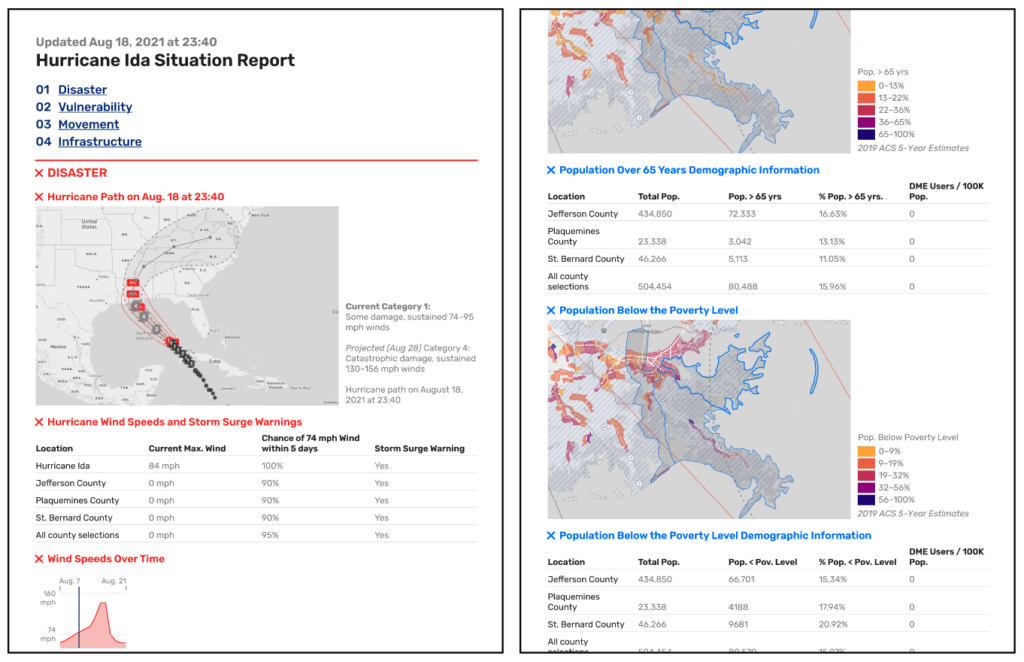
Time is of the essence for responders in a hurricane scenario. We built a report-generation feature that synthesizes an analyst’s findings for decision-makers to quickly understand the areas of interest in reference to the hurricane. The structure matches the outline we built for forest fires to ensure consistency for those potentially looking at both fire and hurricane disasters in one day. The first section briefs the reader on the hurricane path, wind speeds, storm surge etc. Then, there are sections on vulnerability, movement, and infrastructure relating to any of the places that were selected when the report was made. Any of the generated maps, figures, and tables can be removed and there are sections for the report-maker to add their own notes in order to ensure that the reader can understand the situation as quickly as possible.
It was a pleasure working with CrisisReady to create more efficient internal systems for responding to public health emergencies (that also double as an archive for teaching). It was especially rewarding for us to be able to work alongside these decision-makers and analysts to determine the right data hierarchy, which in turn surfaced our design decision to place emphasis on the “avocado of uncertainty” over the “cone of uncertainty.” Check out more of our work at our website, and if you’ve got data you need visualizing, let’s be in touch!