
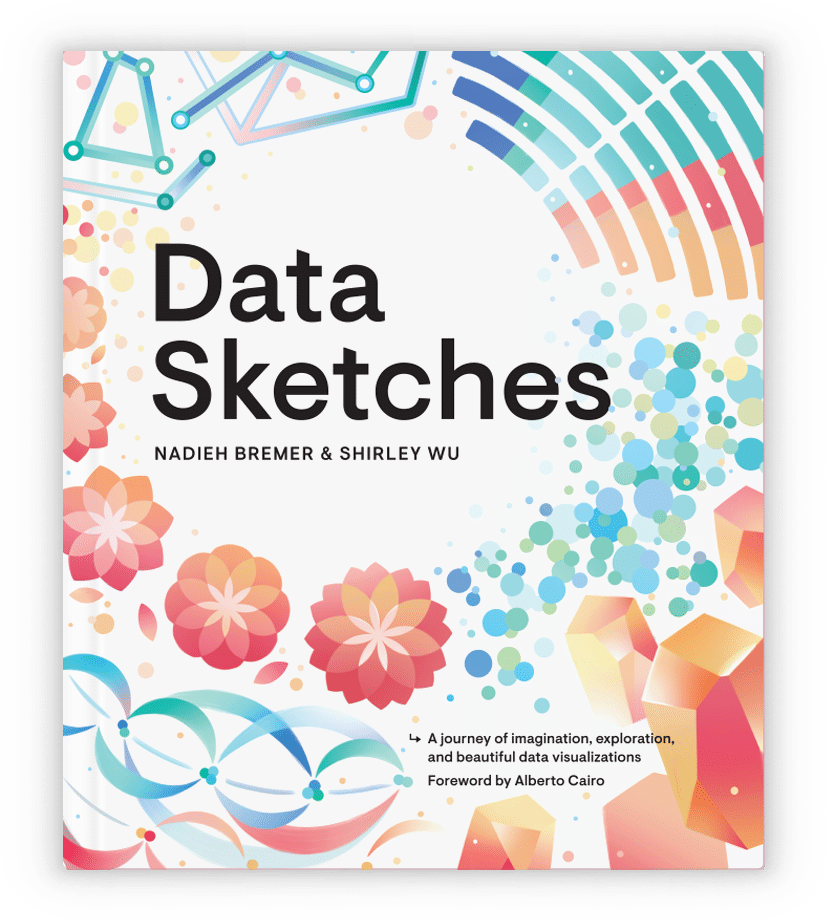
Shirley Wu began creating data visualization for the web shortly after the initial release of D3.js in 2012. She fell in love with the technology after realizing it offered her a way to combine math and art, her two greatest childhood fascinations. After making her way through the steep learning curve with help from the D3 community, she has spent the past decade learning out loud— generously sharing her creative and coding process with the world. Shirley started the collaborative blog datasketch.es in 2016 with Nadieh Bremer as a way to prioritize self-initiated projects and creative experimentation. Fast forward a few years and Data Sketches has become a book that features an foreword by Alberto Cairo. He describes Shirley and Nadieh as “wondrous eccentrics” who “wished to defy what is acceptable” and there isn’t a better way to describe these two humans and their work.

One thread that continuously weaves throughout our conversation is Shirley’s generosity. A simple glance on her website makes this clear: Shirley has been interviewed on no fewer than 30 podcasts, has spoken at dozens of conferences, regularly live streams working her way through coding challenges, and shares many tech experiments on Twitter.
The conversation we had for PLN8 takes place in a moment of transition for Shirley. At the time of writing this, she is wrapping up her first year in NYU Tisch’s ITP Master’s program, a leap of faith that was inspired by her love for learning. Knowing how much technical knowledge she has already shared in her book and elsewhere, I wanted to zoom out our conversation— focusing on this moment of transition reflecting on the “greatest hits” (and flops!) of the past decade.
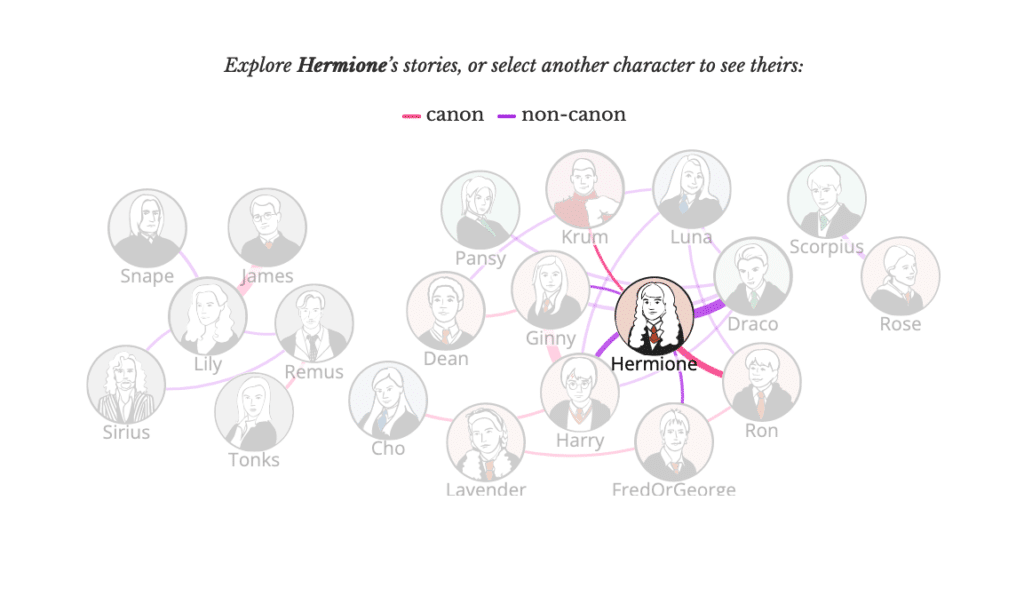
One project in particular, “The Most Popular of Them All” plays an important role in our friendship as the first impromptu collaboration between the two of us. Shirley gathered metadata from harrypotterfanfiction.com to investigate the answer(s) to one of life’s most pressing questions: which characters does the Harry Potter fandom want to see together?
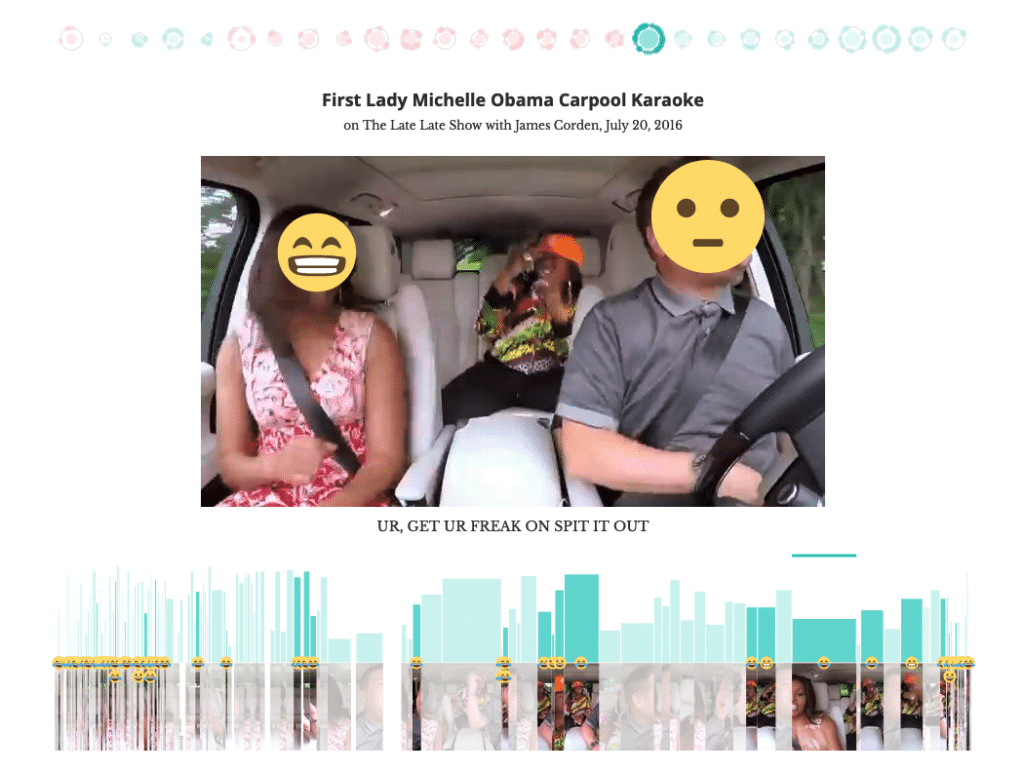
We discussed a few projects that haven’t received as much attention in the public sphere and the lessons that came along with them. One project that stood out to Shirley was “Putting Emoji’s on the President’s Face“— the monumental technical challenge of stringing together technology to analyze video, capture still images, analyze the sentiment of facial expressions, and then present these results in a “scrollytelling” format. This impressive feat of engineering didn’t quite resonate with the masses, but played an important role in laying a foundation of skills that Shirley then applied to her viral project with the Pudding, “An Interactive Visualization of Every Line of Hamilton“.
The world of data, statistics, visualization, and math is often revered as (and reveres itself as) Very Serious Business. If you can tell from the examples above, one of the gifts I admire most that Shirley possesses is that she embraces the playful possibilities when working with data. That doesn’t mean she avoids serious topics. One project we didn’t get to talk about is her collaboration with The Guardian called “Bussed Out“– an investigative journalism feature on the movement of unhoused people in America.
Shirley reflected on how her relationship to data has changed over the years, and the awareness and skillsets required when working with data that is informing consequential or life-impacting decision making. Two leading voices talking about bias in data that we mention during this part of the conversation are Mimi Onuoha and Heather Krause.
Towards the end of our discussion, we talked about what role data and interactive visualization may play in the next chapter of her career. I can’t wait to see what’s next for Shirley!
Grab a copy of Data Sketches to enjoy deep wisdom and eye candy from these “wondrous eccentrics” Shirley and Nadieh. Did you resonate with a particular project? Have thoughts on the ever-changing world of data viz for the web? Let us know on Twitter! And if you enjoyed today’s episode, please help us share it to anyone who might be interested!
Transcript — +
[music]
You’re listening to Pollinate, a podcast on data, design, and the people that bring them to life. Brought to you by Stamen Design.
Catherine Madden (CM): The ever evolving landscape of data visualization for the web, finding inspiration after burnout, working as a woman of color in a male-dominated industry, these are just a few things that come up in today’s episode.
CM: I’m Catherine Madden, a friend of Stamen, information designer, story strategist and facilitator. Today, I talked with a friend of mine about their journey as a data storyteller and how making data visualization for the web has played a role in shaping her identity. Please welcome my guest.
Shirley Wu (SW): I’m Shirley Wu. I’m no longer certain of what my official title is. I used to be a full-time software engineer. I then quit my full-time job to try my hand at freelancing for data visualization. I did that for about six years where I kind of supported my clients through the whole process of creating data visualizations for the web. And last year, I decided to go back to school. So I am now a grad student at New York University in a program called ITP where we learn how to create art with tech, so art with software, hardware, and all sorts of emerging technology. Yeah. And that’s why I don’t really have an official title for myself. Now, I’m just going to say human being.
CM: I love that so much, and I can relate to that. It’s so nice hearing you reflect back on your journey to this moment, and I can’t wait to talk more about your ideas and what you’re learning in ITP. But I do think it would be really fun to spend a little bit of time going back in time and looking back on what led you to this moment and kind of going over the greatest hits of Shirley Wu and her interactive visualization portfolio. And before we do that even, I just was preparing for this and thinking about how wonderful a person you are and how lucky I am to know you personally. And I don’t know, there’s just a little reflection that I want to share. The first time that I encountered you was actually probably before you encountered me at all. It was when I was starting out my freelance career, and I was looking for people who were doing what I was doing, which was hand drawing data. And I don’t know if it was actually I was thinking about starting this career or thinking about hand drawing data as a thing. Maybe I was still at my old job, or maybe I was freelancing. Long story short, I found you and Nadieh’s blog Data Sketches, makes a lot of sense because the word sketching is in it. However, the output was drastically different than what I was imagining, something actually hand drawn.
SW: Yeah, sorry for the false advertisement. [laughter]
CM: But it’s not!
SW: We considered “data sketch code,” but that just felt like way too much of a mouthful.
CM: But I think I was instantly captivated by Data Sketches because it is a sketch.
SW: Thank you.
CM: Okay. There are so many things about Data Sketches that was amazing, and perhaps it resonated so well that it turned into a book for a reason, but we’ll get to that in a moment. But just the fact that you were so generously sharing your process and the failures and sort of the experimental moments or the redirections and surprise outcomes, and it just felt really generous and inspiring. And there were sketches, hand drawn things that were a glimpse into each of your brains as you’re deciding how you want to visualize information and starting with the hand first, which is something I’ve always been so in favor of, as opposed to looking through a menu of chart selections. So that was my first encounter with you. And then my second encounter was when you picked me up at the San Francisco Airport, total strangers. And that was just a really fun day. Our friend RJ introduced us, and we were all going to spend time together. I was traveling from DC to San Francisco, and, yeah, we had this little, meet-cute blind date, whatever you want to call it where before you know it, I think this is the same night, I was illustrating icons of Harry Potter characters for one of your Data Sketches projects, so.
SW: I was going to say how generous you were because I picked you up from SFO because I think RJ was like, “My friend is in town. She’s super cool. You should meet her.” And he arranged for us to all hang out together on the same day. And then I was asking both of you for feedback on one of the Data Sketches projects, which I was extremely, extremely stuck on. I think one of the things about data visualization is, especially as someone that doesn’t have a formal training in it, I feel like there were moments of imposter syndrome with the design side of data visualization, and I think that was the peak moment that I was going through that imposter syndrome. And I was asking you [inaudible] you both for feedback. And then it came to a point where you were like, “Oh, I can illustrate these Harry Potter icons for you.” And I was like, “Wait, really?” And you were just so generous, and I was so happy when you moved to San Francisco.
CM: It was super fun. And I got to say, part of what drew me to San Francisco was fun, magical moments where you’re hanging out with like-minded people and all of a sudden putting together hand drawn illustrations of the top 20 characters in Harry Potter so that Shirley Wu can create a network map of fan fiction romances, of course.
SW: That is exactly what the world needs.
CM: Oh, man, I think it does. Okay, we’ll get to that as well, sort of the beautiful question of why should I do this and then maybe challenging it with why not? But yeah, I did move to San Francisco, and then we became even better friends because a studio space opened up in the workspace that you shared with some other amazing creative folks. And that was a great couple of years. I feel like a couple of the highlights of that time, for me at least, were watching you transform the Data Sketches blog into a book that is amazing. For those of you who haven’t seen it or heard of it, definitely pick it up. It is a work of art. It is informative, it is fun, and just so many fun projects that are featured from start to finish. So that was really fun to watch you create, as well as learning how to laser cut in an anarchist maker space together. That was for one of your first physical installations of data visualization that I don’t know, maybe put you on a path to this thinking about what could I do with more physical art instead of digital. And yeah, I want to go back to that in a moment, but now that’s where we find ourselves today is on separate coast back again, sadly. And you’re doing this amazing program at ITP. So let’s just start with a simple question. Where are you at this moment, both literally and physically or physically and non-physically?
SW: Yeah. Okay, I got you. Well, I was also going to say to follow up a little bit about what you were saying is I had such a great time, and we had a studio. We shared a studio space in San Francisco. I had such an amazing time sharing that space with you, I think, because I feel like you’re just so very self-aware. And so I feel like you just gave me such great feedback and advice sometimes when I would be really frustrated with a client or a situation, and I was just venting. And then you would just come back and be like, “It’s okay.” And you had such a great perspective that I appreciated. And it’s because of you and one of our other student mates that I was like, “Oh, I should get therapy,” not that you said that, but because of how self-aware you were, I was like, “Oh, this is a really good thing.” And I didn’t go for therapy, but I went for life coaching because of your advice. And I’m really, really benefiting from that. So I guess that’s part of my answer, which is physically, I’m in Brooklyn because ITP is based in Brooklyn, but I think non-physically, I’m in this, I guess, a place of transition where I think it was actually writing that Data Sketches book. The Data Sketches project that Nadieh and I worked on was twelve topics, each topic turning into a data visualization project that we went and got the data and analyzed it and designed. And that’s where the sketches came in and coded all from scratch and documented the process. So that took four years. I think Nadieh was much faster at finishing the projects. It took me four years to finish all twelve projects and then kind of trying to– because it’s one thing to have a blog post or a blog online where you’re just putting stuff out, and you don’t really even care that much. We didn’t actually expect any readership, so we were just dumping our thoughts. Nadieh, she tends to explain every detail, and then I tend to not explain any detail. Mine is just like screenshots.
SW: And turning that into a book was a lot, I think, even from a mental exhaustion perspective of trying to elaborate on what my thought process was or figuring out how to– basically, we just wanted to make sure that if people were going to pay money for something that we already put out for free that it was out of quality and standard that would be worth it. And that process I think was just so hard for me. I think by the time that we handed in our finished manuscript plus designs, I was just extremely burnt out. And the greatest irony is that I went into the book hoping that it would give me more clients that would hire me to do things like what was in the book because that book is basically a love letter to data visualization and the kind of data visualization projects that we loved making. And so I was really hoping that clients would come and hire us for those kinds of visualizations. The irony is that as soon as we handed in the designs and the final files, I was like, “Nadieh, I think I’m so burnt out. I don’t think I want to do this anymore.” And I felt really lost for a good half a year where I was like, “This thing that I loved doing for basically all of my career, a good eight or nine years, I don’t know if I want to keep doing it anymore. I don’t even want to look at my own work. I don’t want to look at the words I wrote.” And because I didn’t know what I wanted to do next, there was a lot of introspection and trying to figure out what did I like. And I realized that one of the biggest things I love about data visualization is all of the learning that we have to do because doing data viz on the web means having to keep up with all the stuff that happens in the web and JavaScript. But there’s also the design side. There’s also all of the data analysis and data science side. And realizing that I loved the learning is what made me realize, “Oh, I want to go back to school, and I want to just dedicate a good amount of time to just learning new things that hopefully will get me excited again,” so.
CM: It’s really awesome to be in a– I can imagine. Maybe I’m speaking for you, but to have the structure of a learning program where– we’ve talked about this a lot, being freelancers and trying to prioritize self-initiated learning and motivation, things that aren’t driven by what a client needs from you and what is going to directly bring you money, it’s just really hard to do, so good on you for prioritizing this structure and really looking inward and figuring it out because I think that maybe data visualization will come back in some way in your work, and I have a feeling it’s just going to infuse itself no matter what. But it just seems really brave to sort of step away from something that you’ve built such a name for yourself and a career around, but–
SW: Thank you.
CM: I’m also just looking at this book and thinking about if you never touch data visualization again, what an artifact to leave behind.
SW: Thank you so much. I am feeling a lot of FOMO. I have a funny story that I was going to tell you off the record, but I don’t really care that much that it’s on the record, which is I went to this meet up, data viz meet up a week ago or something. It was a Pudding meet up, and I was just really excited because I love the Pudding, and I love–
CM: Love The Pudding.
SW: –catching up with them. I love catching up with them. But there was also a lot of non-pudding people there that are in data viz and there was in particular a group of students that are in a data viz master’s program. And then I guess there was someone there. One of the students was on his way out and he was like, “Oh, my classmate or my friend wanted me to invite you to the party that I’m having this Friday. What do you do? Do you do data visualization?” And I was like, “I guess I’m not really in data visualization right now.” I’m like, “I don’t know. I don’t know what I’m doing. I don’t know if I want to do data viz.” And he’s like, “Oh, cool, cool. I’m in the data viz program, but I’m not sure if I’m into it. I’m not sure if I want to do it after graduation. Cool.” [laughter]
CM: I love that. It’s like you’re on the outside of your own self like, “Wow, this is what I’m saying about who I am at this moment.” Just fun to notice moments like that.
SW: Yeah.
CM: I’m wondering if we can go– at this transition point, I feel like we have the artifact of the book as a journey through Shirley’s, not life in data viz because only twelve projects are featured, and I feel like you’ve done so much more than that. But what brought you to data visualization in the first place? I know you studied business at Berkeley, and then you were working as a front end developer, is that right?
SW: Yeah, yeah, I guess it depends on how far back we want to go. I was studying business in university, but even before then, just all throughout my childhood and my teenage years, you know this. You noticed that I love art. Sometimes, I love what you and Alice do and Amy do and when you draw. I loved art growing up. I did a lot of watercolor, took a lot of classes in school, and at the same time, I loved math. Math was my favorite class the entire time until university. And then I got too intimidated by people that actually were good at math [inaudible].
CM: Whatever that means.
SW: And then I went into business. And then while studying business, I think I was in my junior year, and I realized that, “Oh, I miss math.” And I kind of really loved the computer science classes that I tried. And so I got into coding and then started at a big data company after graduation where I just so happened to be on the front end team, just so happened to have a really great manager that was like, “Hey, you’re new. This thing called D3 just came out last year. It’s super new. Do you want to give it a try? Because you’re not on any projects yet.” And I’m like, “Cool, sounds good.” And then when I started doing that, I realized how much I loved it because it was basically all of the things I loved as a child. It was art and math. The geometry part of it was super fun. And also the thing I fell in love with in college, which was the coding. I don’t think the business part really came in at all, except that the business part was extremely helpful when I was going off on my own and establishing my own business. And the number one lesson I learned from my business degree is to hire an accountant because I am not messing with US tax law.
CM: Nope, I second that. So it’s really cool to hear that it just sort of clicked for you. And also, as you’re saying that, I’m just thinking about how much the world of data viz has changed because your manager was like, “This new thing called D3.” And I don’t know what the question in this is. It’s just a reflection on the growth of the data visualization, not just community of people doing this work and appetite for it in industry, business, wherever, but also the tools. And I don’t know, something that I feel like you’ve really done exceptionally well at is sharing your learning and process. For those of you who don’t follow Shirley online, she’s constantly live coding on Twitch, or in this new era, sharing her experiments in the ITP program with physical technology. But what made you decide to be visibly learning so publicly?
SW: Oh, what a great question. I feel like there was two parts to that question. The first part being how has data viz evolved? And then the second part being the learning part. I think the first part is really interesting. This is what I was trying to say earlier that I wasn’t quite doing a good job at, which is I feel both FOMO about the date viz world because I feel like it’s getting even more exciting, and I’m not really up to date on it because school just takes up 100% of my time. So all of that to say, I’m not 100% sure what’s going on in data viz right now. But I think up to a year or two ago, some of the things that were really exciting is D3 hit its 10th birthday last year. It’s now on its 11th year, which is super exciting that it’s still so relevant. It’s still one of the most powerful tools of making data viz. I think one of the things that’s been super interesting is watching all of the ways that people create data viz because I feel like when I first started, I think a lot of people– for the web, at least data viz for the web, I can’t speak for other parts, but data viz for the web was like everything was done in D3. And now I feel like maybe D3 isn’t used as much as Vega, and Vega-lite took over for a while. Observable, Plot is I think getting bigger and bigger. And now these are all kind of abstractions on top of, or Observable and Plot at least is an abstraction on top of D3. There’s always been a lot of charting libraries. I think both Flourish and–
CM: Oh, I do Flourish.
SW: Yeah, Flourish and DataWrapper have made charting really easy for their target audiences. Stamen has been around for so long, creating data visualizations, I’m sure– Mostly I think my understanding is in cartography, but I’m sure they have also seen all of the different changes. So it’s been super interesting to see. Oh, and then, how data journalism has evolved also, I think has been really, really cool to see. But in terms of why I started sharing, I think it’s because when I first started learning D3, I was the only person in the company that was trying to learn D3 at all. My manager was also learning. He was kind of mentoring me through it, but there wasn’t anybody else in the company. And so I didn’t have anyone to ask questions, really. I didn’t have anyone to bounce ideas off of for a data viz. So I joined this local meet up group called Bay Area D3 User Group. And that is still some of my favorite friends that I have made through that group. And they were just so generous with their time and their knowledge. I would have questions, and they were just like– I remember the first time that D3 made sense for me was because they had hosted kind of like a hack day. And then I just sat down and asked questions for a whole afternoon. And Ian, who’s one of the co-founders, always used to say like, “D3 is challenging enough that we don’t need to add any barriers of entry.”
CM: Yeah. Let’s get rid of the gatekeeping in this one.
SW: Yeah. So I think it really was that kind of culture of trying to be open and welcoming and also sharing your learnings. And I think the first time I distinctly remember being like, “Oh, this is such a cool thing,” was I had written a blog post about using D3 with Backbone, which is kind of the thing that people were using before React and around the same time as Angular, these web JavaScript framework technologies. And I had written that blog post and had given a talk at the D3 meet up. And then afterwards, there were people that came up and was like, “I’ve been having that experience too. It’s really cool to see how you solved it. This is how I went about it.” And I just loved that information sharing that happened because I have put something out. Then people were so generous to share about– yeah, they were generous and sharing their knowledge back. And I think that’s what really started it. I mean, there’s also kind of the ulterior motive of I was doing a lot of speaking because I was hoping to get on the conference circuit so I could travel around the world on someone else’s money. But there was also the part about people being really generous with their knowledge because I had shared, yeah.
CM: Check and check, yeah. I mean, it’s like giving back to a community that gave something to you. And as we’re looking back, I’m curious to hear what your experience was as a woman of color in this community.
SW: Oh, what a great question. So I think being a woman of color in tech is really hard. In general, I tend to have a pretty ignorance is bliss sort of personality where for a really long time, it didn’t even– I think it’s twofold. It’s like both. I was just like kind of didn’t really recognize it happening, but also because I had– it’s not one of those– it’s basically like when you grow up with misogyny in a society, you just don’t really recognize it, right? And actually, I think it’s the friends I made through the D3 meet up that made me realize as well as there were some people in React Rally Conference that helped me realize, which was that– there was one distinct memory I have. In the D3 meet up, we used to always end on show and tells. And then there were a bunch of other people that had gone before me. Unfortunately, I think there were a lot more men than women in a lot of these meet ups. I still don’t know how we could work on that, but that’s one of my other personal things of trying to be more visible so that hopefully more women would feel comfortable coming to these events. But I remember there was one time where a few men had gone before me in terms of showing their project, and then I was the last one to show my project. And then I guess someone in the audience just kept on being like, “Oh, have you done this? Have you done this? Have you done this?” And I didn’t think anything of it because I’m so used to people asking me why I did something in my code or how I decided to architect something that I was like, “Oh, I already tried that. Here’s the reasons why I didn’t do it that way.” Like, “Oh, I considered that. But these are the reasons why that didn’t work out.” Didn’t think much of it. And then afterwards, it was some of the other organizers of the D3 group that was really, really upset on my behalf, which I’m really grateful that they were. And they were like, “We need to moderate these Q and As so that this kind of thing doesn’t happen. Because that same person that asked Shirley all of those, it wasn’t even asking. It was like, ‘You should do it this way.”
CM: A little bit of mansplaining in there.
SW: He didn’t do that for any of the previous– he had asked questions of the previous people doing show and tell that were much more respectful than the way that he was, yeah, mansplaining to me. And I was like, “Oh.”
CM: And isn’t that funny how until someone else points it out, you don’t even– it’s almost like a self-gaslighting that’s happening like, “Oh, no, this isn’t really misogyny.”
SW: It wasn’t even gaslighting. It wasn’t even self-gaslighting because I didn’t even have the thought that it was. It wasn’t even that I was denying myself that this was sexist. It’s that I had grown up with it all my life that it was just normal to me. And until someone pointed out that it wasn’t normal, I was like, “Oh.” There was another time in a conference where in the middle of my talk, I was showing code, and someone all the way in the back yelled out, “Can you make that font bigger?” And then totally interrupted my talk in front of like 500 people. And I didn’t think that much about it. And I tried a few times, and I was like, “It seems like I can’t make this bigger, but all of this code is on my repo that you can check out.” And I went straight back into my talk, and some other attendees were just livid on my behalf. They were like, “That person should have sat closer to the front. He wasn’t that way with anyone else.” So it’s those moments where– I don’t think this had a point, I think. I mean, I guess I’m just now talking about experiences.
CM: Yeah, well, I mean, I think it’s, number one, again, generous of you to share what those more negative experiences are like because I think folks, perhaps the ones that are not even aware of their own willingness to walk over certain types of people and have more reverence for other types of people. It’s like you’re just sharing this in perhaps an effort to let people know like, “Think about it. Before you react in certain ways, think about who you’re talking to and the implications of that. And would you speak this way or demand a larger font size audibly in a large auditorium–”
SW: If it wasn’t this Asian woman speaking in front of you? Yeah, I agree.
CM: Yeah. And just to go back to the thing you said about representation, I think it’s really big. I don’t see a lot of women of color super visible doing what you’re doing. And so I can imagine there are a lot of folks coming up in the younger generation that can see your work and feel like, “Oh, there is space for me in there,” so.
SW: On that topic, I think after a few years of speaking at conferences, I did have quite a few moments of like, “Why am I doing this?” Because I enjoy it afterwards, but beforehand, I get so nervous. I think this is on the topic, kind of. I think the two stories I shared were much earlier in my career, and ever since, I’ve become more and more aware of it. And I think there’s also kind of this other part of it that’s the more I’m aware of it, the more I’m aware of even in a conference circuit, there’s so many more men that tend to be on the speaking that are giving the talks than the women. And then there’s this kind of onset pressure for the women to deliver perfect talks. If I deliver a less than perfect talk, I just get roasted on Twitter. And so after a few years, I was like, “I don’t know if I want to do this anymore,” because I get so much anxiety before a talk that I’m literally queasy, and is this worth my health? And then there was a moment where at a conference, there was another woman speaker that came up to me, and she was like, “Hey, Shirley, I just wanted to say that you inspired me to start speaking also because you spoke at this one web conference years ago, and you were one of the only women speakers. And seeing you on the stage, I–” and I was like, “Oh, my gosh, I didn’t even realize that was an effect I was having.” And it was such an amazing feedback and realization that after that, I was like, “Okay, I’m suffering, but I’m suffering for a reason.” Yeah.
CM: Yeah. Yeah. I’m glad you stuck it out, but I’m also glad that you in the process are getting re-enforced or re-encouraged and still on the speaking circuit for upcoming Eyeo. I’m hoping I can get to see that, if not in person, maybe the recording of it. So I want to just maybe stick to one more thing looking back on the chapter of data viz in Shirley Wu’s career, and it’s kind of like, what is something that you’re most proud of that maybe hasn’t been a part of the things that you’re promoting online, like Data Sketches book or whatever. I know you’ve done a lot of projects that either were internal for clients or maybe just got less publicity than you felt warranted or felt excited. The excitement that you had for the project mismatched the reception of it.
SW: Oh, that’s such a great conversation. And it’s something that we’ve talked about a lot when we were in the studio together. A lot of our conversations were around that or clients. But I think certainly there’s some of my projects that have had more attention that I think has shaped the way that I think about the work I do. This is such an interesting question because it’s specifically projects that I haven’t thought that much about or that I don’t promote that much and how it might have had an impact on me, or– oh wait, sorry, it was the expectation and mismatch. I think there’s been quite a few projects where I put so much of my time into it. One of them is the emojis on presidents’ faces.
CM: Let’s break this one down then. Let’s hear all about it.
SW: Well, so that one, I think was a very valuable lesson, which it was one of my earlier projects after I went freelance. So this was 2016, and I think I was very much a software engineer, right? In the sense that I’m like, “I just want to do something that’s technically challenging because that’s fun. I want to solve the technical challenge and [crosstalk]–”
CM: What was the technical challenge in this case?
SW: So that one was just trying to figure out if I could string the tech together. So that project was I downloaded– so it was going out and getting every YouTube video of the Obamas on late night TV shows. Then essentially I wanted to run sentiment analysis or emotion. I wanted to capture emotion.
CM: By reading facial expressions?
SW: Yeah. Yeah. So there was a paid app where you could upload videos, and they will spit out, I think, second by second or something if they were angry or happy or whatever. But I was like, “I don’t want to pay money because I’m broke,” and so I just like–
CM: I can do this.
SW: Yeah. I shrunk a bunch of different JavaScript libraries together where I wrote a script to programmatically download all of those YouTube videos, then take a screenshot every time they talked. So the context was this was, I think, part of the D3 [inaudible] that was sponsored by Google Cloud at the time. So Google Cloud had this software that would analyze for emotions, or they would detect the faces and analyze for, I think, five different kinds of emotions or something, and so then upload each screenshot, detect their faces, get the emotion back, and it might have just been positive or negative emotion. Anyways, so, yeah, that was the whole chain of data processing.
CM: And you also have to decide if it is– okay, so say it is just positive or negative. You have to attach then an emoji, or you decided to then choose an emoji to attach to either one of those?
SW: Yeah, yeah, yeah. So then I think after I got the data all figured out, it was then just trying to figure out how to present all of the data. And this was the project right before the Hamilton project where I was trying my hand at scrollytelling, and I wanted to do a scrolly piece. So not only had I spent a long time trying to gather the data, but then I was trying to figure out how to present it in a story. And I think I spent a really long time on that project, and then nobody really cared. And I was so sad because I was like, “But look at all this data. Look at all the emojis I put on their faces. Look at all of these visualizations that I got scrolling and animating across the screen.”
CM: Would it be fair to classify this one as high on the Gizmo gadgetry and low on the actual storytelling perhaps?
SW: Yeah, that is exactly what happened. And that’s the biggest lesson I learned from that project, which is that I can make the flashiest thing, but people aren’t going to care if that story doesn’t resonate with them. I was just putting out data. The paragraphs were about how I got the data and the numbers and summarizing the numbers. And that’s not something anybody really cares about.
CM: Well, super fascinating for probably a subset of people if you are trying to– for the Hamilton one, I think, it was a huge hit because it’s obviously a show that is wildly popular. And yeah, it just hits on more of those human interest things that has the story and the amazing form. I love going back and looking at that every now and then, but.
SW: Thank you so much.
CM: You’ve talked about Hamilton a lot and other aspects of the book. So if you want to say more about Hamilton, I’m here for it. But I have other questions, too.
SW: I was actually going to mention one other project. I think after so many years of putting out projects, I’ve learned to disassociate how people react to a project versus how I feel about a project, but another one where I just couldn’t do that dissociation, and I was really, really bummed. I think it also fed into the burnout that was caused by my Data Sketches book is right before we finished everything for Data Sketches book for the fall of 2020, I had decided that I wanted to work on something related to the election because I tend to learn things by looking at data and kind of trying to make visuals for it. So I just wanted to see how much I could learn by making a series of small bite size data visualizations for the election. Yeah. And it ended up a project. I ended up calling it makemyvotecount.party, and I put in so much of my– I don’t know. I don’t know how to describe it, but I worked really hard. I really cared about the little stories I was working on. I hired a small team to help me vet the stories because I really didn’t want to add to any misinformation. And overall, I just really cared about the project. And this is going to sound really entitled when I say it, but I cared so much about the project that I was hoping that other people would respond in kind because of how much I cared about it.
CM: No, that makes a lot of sense. It’s just honest. I don’t think there’s entitlement in that. It’s just like, “I want other people to care about what I care about.”
SW: I was just like, “I want the numbers to come in because of how I worked around the clock for it.” No, that wasn’t it. But I’m still to this day trying to figure out what made the project not as successful from a kind of engagement perspective. I don’t think that many people saw it. But unlike that Obama’s project where clearly I can understand why it wasn’t as interesting to people. For that one, I do feel like I did the best I could do for telling the stories in bite size chunks.
CM: What is the URL again?
SW: Oh, makemyvotecount.party. But the best guess I have is that the timing was bad. It was October of 2020. Everybody was fed up with the whole misinformation thing, and nobody wanted to hear about the election stuff anymore, especially from just an independent person doing data viz. And also, I think all the social media platforms were–
CM: Suppressing things?
SW: –suppressing election-related things. So I think that was the problem with that project.
CM: I feel like this has been a journey for me of not only losing interest in something that has just become more ubiquitous, right? Like, well done data journalism, and there’s just more noise in this space. But at the same time, I’ve lost some trust in data itself and the myth of objectivity. And I’ve been learning about how bias is embedded in every step of the visualization, data gathering, data analytics, visualization and communication process. So it’s been a journey I’m just examining and hoping to talk to more people about in this moment. How has your relationship to data changed over the years when it comes to that? Sometimes you’re going out and finding things that are really obscure, like Harry Potter fan fiction relationships and quantifying and counting things that are just data for fun. But yeah, I guess I’m just curious how you feel about almost the inclination of folks in business and government to exalt data in a way that makes it feel like the only source of truth.
SW: Yeah. I love this topic that you’re bringing up. Yeah, love is a weird word, but I very deeply care about this project.
CM: Thinking about it as well.
SW: Yeah, it’s a very complex topic. I think I used to be like, “Oh, data is infallible.” This is naive young Shirley.
CM: Same thing.
SW: And I think the most eye opening talk that I’ve watched was– her name is Mimi Onuoha. I’m not quite sure how to pronounce her name, but it’s spelled O-N-U-O-H-A, I think. She had an IO talk in 2017 about data collection and how data collection is inherently biased, especially considering race and gender. Sometimes, it’s subconsciously biased. Sometimes it doesn’t have any bad intentions. But then if they’re of one race and gender or background, and they might not consider getting data for any other group because they only have their own lived experiences.
CM: There’s that infamous trope of any sociological or psychological study is done on college students, right? So your sample size is very specific.
SW: Yeah. And sometimes some of the reasons that she cited were so interesting from a historical perspective of like, “Sometimes it’s just because they didn’t have the funding to go to all of the towns to survey the town. And so then they just surveyed the richer towns who happen to be more affluent white families.” So that talk I really highly recommend. And then I think after that one, I started thinking more about how we do data collection. I haven’t read Alberto Cairo’s book about how charts lie, but I would imagine that would be a really great read. Yeah. I just really agree with you about how data, statistics, and charts, we just have this impression of them that data is cold, hard fact and truth and that what you read on that chart, it must be a cold, hard fact and truth and how not true that is and how we should always read the methodologies. I think the first step for any chart, making sure that there is a little source, data source.
CM: A source, yeah. Where did this come from? [laughter]
SW: And then I think the biggest example for that for me was COVID was starting to become bigger and bigger in March 2020. And all of a sudden, there were this huge influx of all of these charts with red bars or charts with red circle or maps with red circles on them. And then we were having a really big discussion in the community about if we should be putting out all of these charts because that is one of the biggest examples in imperfect data collection where some governments are trying their best to collect the data, but then they have different ways of measuring case counts or mortality counts. And then there are some governments that are purposefully suppressing the numbers. So the case counts are lower than they should be. I don’t think I have an answer. I think it’s that we as data professionals just have a responsibility to be as mindful as possible, acknowledging that we all have biases in each step of the way, be mindful of that, and then to put as much as we can in the methodologies.
CM: Yeah. I really like the concept. Someone I’m learning a lot in this realm from is Heather Krause. She has a couple of courses on data equity, and she has the concept of a data biography where it should be part of any data project in one of the earlier stages where you map out who’s funding this project, what are the power dynamics in that, who is profiting off of this relationship, and then, yeah, what are the sources? How did you collect them? All of that information and some really comprehensive biography. But then it puts a lot of work on people who are going to use that data and information. I think it’s really just more important in situations where the data is informing very consequential decisions and maybe less important when it’s just an experiment or something artistic or playful.
SW: Yeah. I do think more and more that data literacy is so important because I think to your point about, yes, if it’s a very consequential decision, that’s really important that the person on the other end of the visualization is aware of the data. But I do think that it’s important from day to day that people– like if someone reading– I mean, I trust most of the newsrooms. So let me just say I think it’s more the more harmless those Facebook charts that go viral that has no basis. So I do think that it is important for people in general to have an increase in data literacy so that they like– I literally had to one of my family members be like, “This is how you check if a chart, if a data visualization is true or not.” And you’ve had that experience, too. And I think that’s what’s more and more important because we can be like, “Well, individuals that aren’t making these decisions maybe aren’t that important.” But I do think the masses being well informed or poorly informed, I mean, that is basically the whole misinformation thing.
CM: Given where you came from with data, what we just talked about, sort of the pitfalls and concerns that we have, is there space or is data finding its way into the learning and the ideas that are coming to you in your ITP program? I think do you have art shows and a final project? And I guess what are you learning? I keep asking you four questions at once, but yeah, I just want to hear about what’s going on at ITP and if data is playing a role for you at all in this learning journey.
SW: Yeah. So I’ve been taking a lot of hardware and fabrication classes. So those are digital fabrication, laser cutting, data [crosstalk]–
CM: Okay, I was going to say, what is fabrication?
SW: Yeah, fabrication is– I don’t have a formal definition. My understanding based on the way people keep using it is you make things. [laughter]
CM: Like physical stuff. Yeah, yeah.
SW: Like physical stuff. So if you have a good shop, and you’re fabricating something with all of the machines in there, but digital fabrication, the class I took was laser cutters CNC machines, CNC routers. So that’s being able to– think of a pen plotter. But instead of a pen, you have a drill bit that’s drilling into the wood or metal.
CM: I have ended up on CNC TikToks. So I’m familiar.
SW: Amazing. Amazing.
CM: It was fascinating.
SW: My favorite was last semester, I got to use this for access CNC mill, which is this fancy way for saying instead of just being able to go XYZ direction, it actually rotates. So then you can make something that’s more cylindrical, something that’s more curved in shape, as opposed to just only being able to go from the top. Of course, there’s 3D printers. We have an embroidery programmable embroidery machine, which was really cool. Yeah. So those are the fabrication side. The hardware side is a lot of Arduinos and sensors and lights and motors.
CM: I mean, as you’re talking about this, I can imagine a million different data visualization applications. I’m thinking the CNC– I’ve seen some topographical maps carved with CNC or embroidered. I’ve seen map quilts. I’m thinking of all different types of creative blends of once you learn that skill, how it could be applied. Have you been thinking about those things?
SW: Yeah. Well, so I think in my first semester, I really struggled because every single project that we would be assigned, I’d be like, “Okay, how do I get data into this? What is the data visualization potential with this?” And then I was like, “Oh.” First of all, the turnarounds for these projects are three weeks. In any class, we will have two or three week turnaround for our projects, and then each class has a project due, and I’m like, “I don’t have the time to be able to go and collect the data set, clean it, analyze it, and then make into a visualization.” So first of all, just from a timing perspective, it was kind of unfeasible. I think another thing I realized in my burnout is I love telling data driven stories. And so that’s something I want to keep doing even after graduating from the program. I do want to blend all of that together. And it’s less about data visualization for web but just data driven stories and a much wider set of mediums. Having said that, I don’t think I need to force myself to do data driven projects for every– because literally in one semester, I’ll have a dozen projects that I have to work on for all of my classes, so.
CM: It kind of feels like the point at this moment is just to learn the tech, right?
SW: Yeah, the exploration. Well, so I think it’s been a really interesting program because on one hand, the classes I’m taking is about learning the tech, but it is still a semi art program. So it’s also about–
CM: Oh, it’s so hard.
SW: Yeah, so it’s also about self-expression. And I think one of the richest things I’ve learned is if art is about making a statement, then what’s the statement that I want to make?
CM: That’s what I was lamenting is so hard. What do I want to say?
SW: Yeah, it’s so hard. You went to art school. You studied art.
CM: Yeah, I had a degree in, yeah, studio art, and, yeah, I liked just making things and then being like, “Here’s a 13 sided object that I think is pretty cool.” And then like, “But what does it mean?”
SW: Yeah, and so I’m constantly in that doubt of like, “I just want to make this pretty thing.” But I think I’m just putting the pressure on myself of like, “But I need it to mean something.” But I think it’s been really cool to also think about the fact that in the data visualizations that I’ve created, I think I’ve very rarely put myself in it, except for a few of my Data Sketches projects that were my own data, like working with client data or working on just like– the self is always removed, right? Like, if I’m working on COVID data, I shouldn’t be inserting myself into that. This program has been an opportunity to be like, “Oh, what kind of projects and what kind of data sets do I want to work with where I am inserting my own experience into it? What are the stories, my own personal stories that I want to tell?” So I’ve been really exploring into that. And I think what’s coming up is a lot about culture, about being Asian American, being a woman. So those are the kinds of things that I’m exploring. And sometimes if there is a data set that’s relevant, then I’ll bring that in. And that’s been really fun. Yeah.
CM: Yeah. You said something a while back that I’m going to bring back is when you start working with data, that’s how you learn about something. And I think that’s why I’m so drawn to personal data visualization and making a pie chart about your week or just learning about yourself in the process of making something or even pretend quantifying and categorizing parts of your life. But, yeah, it’s also scary and vulnerable then to put it on display and have it judged in school or by the public, so.
SW: Yeah, that’s true.
CM: I can relate to the–
SW: The vulnerability of that, yeah.
CM: Yes. Yes. But I can’t wait to see are you going to have a show at the end of the program or midpoint for folks that are in New York? Is there any way they can see what you’re doing?
SW: Yeah. So ITP always has end of semester shows, so we’ll have a spring show. We have fall shows and spring shows. Unfortunately, our fall show got canceled literally the day before because of Omicron. It was real bummer. So this semester, they’re saying that it will be in person tentative, and they will decide probably literally the week of whether they’ll let non-NYU people in.
CM: Got it.
SW: But my hope is that I’ll be able to put on a show just like outside of NYU facilities. I’m hoping that I can find a little space, like a tiny gallery space or something to maybe put on a little weekend show together or something. Fingers crossed because I have not made any headway on trying to find a gallery space because school just takes up all of my time.
CM: I bet. So I guess if folks are in New York and interested in checking out your work, they should just check you out on Twitter and see. I’m assuming you’d be sharing it there if it became either the gallery or the NYU program opens up their showcase, right?
SW: Yeah, I’ll try my best. I’m super bad at self-promotion, so.
CM: People want to see what you’re doing.
SW: Thank you. Thank you.
CM: I guess the other thing we can plug for you is the upcoming talk at Eyeo.
SW: Oh, yeah. Thank you.
CM: Yeah. Does it feel like there’s anything else you want to hit on or get out there?
SW: Yeah. I think to add to the trying to moment as an opportunity for self-discovery, I think I’m learning a lot about myself that I do want to start incorporating more into the work I do. So I’m not sure if any of my future work will be relevant to anyone.
CM: I think to build on that, there is something about specificity of an individual’s experience that becomes universal. This is why Taylor Swift is so popular because she’s talking about the moment in a waiting room and the coat that she was wearing at the time. Another person I think of is Alison Bechtel. She wrote the graphic novel Fun Home, which is now a Broadway musical. And it’s like no one else has lived her life and her story, but people see themselves in the specificity. So I guess that’s amusing and an invitation that maybe you don’t think it would be relatable to talk about something that isn’t universally understood or known, but–
SW: Yeah. Thank you, Catherine.
CM: –on some level, it is.
SW: I feel like that was exactly the kind of therapy conversation we used to have in the studio. Thank you, Catherine.
CM: And thanks for saying nice things about me.
SW: I always have very nice things to say about you.
CM: It’s probably why I like being around you, in addition to the fact that you’re fascinating and very cool, and I keep coming back to the word generous. You’ve given us so much time during this conversation.
SW: Well, thank you for letting me ramble.
CM: Yeah. I think a lot of people will be stoked to hear where you’re at on your journey, and so thanks. And–
SW: Thank you.
CM: –I think that’s a wrap!
CM: Thank you for listening to Pollinate. Thanks to Shirley for our conversation today. Music for Pollinate was created by Julian Russell. You can find Shirley’s book Data Sketches on the website datasketch.es and other works of hers at shirleywu.studio. If you liked the show today, we’d be so grateful if you shared this conversation with friends, family and other folks who might find it interesting. You can also share your thoughts with us on Twitter at Stamen using the hashtag PLN8. For a summary and full transcript of today’s conversation along with some other visual examples we talk about in the episode, check out the blog post at stamen.com/blog.