blog/Cartography

Stamen + MapLibre

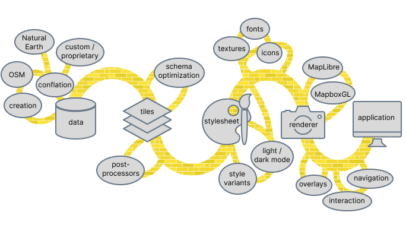
We are happy to share that we have begun work on improving MapLibre Native with technical leadership by Wet Dog Weather and funding from AWS. MapLibre Native is an Open Source SDK for rendering maps on mobile and other devices. We at Stamen rely on map renderers to display the beautiful maps we create for...

Make your own globe-spanning Jack-o’-lantern

Look at this fun thing. You can carve a pumpkin on the globe! I can’t believe it. Isn’t it fun? It is. I am fun.Here are a few more. If you want to be fun too, try it at stamen.github.io/pumpkin. Also what is fun is that your carving is stored in the page URL.  If...

Shadows on maps are getting a lot more exciting, and here’s why

| 09.16.22

As cartographers, we want to make beautiful maps that grab our readers’ attention. Sometimes we wish our maps could jump out of the screen or off the page, and with a recent trend in cartography we’re starting to see more and more maps that seem to do just that.  New technology combined with high-resolution elevation...

More ways to make your maps go Dark Mode

The other day at Stamen we were talking about a recent post by esri’s John Nelson called “Create a Light or Dark Version of Any Map in Two Seconds” using ArcGIS Online Map Viewer. So of course we were wondering how we could do the same for Mapbox GL styles. We often have to design...

Visualize a cross section of your map with Chartographer

| 08.16.22

At Stamen, we work with clients to improve their interactive cartography experience, frequently building full basemap solutions for large corporations who have very specific needs and exacting standards. Doing so means wrangling complex global data into beautiful, performant maps, controlled by elegantly written stylesheets. Most web maps have a near-endless amount of detail that can...

Pollinate Ep. 7- Ross Thorn & The Realm of Playful Maps

| 06.09.22

In the “real world” a map is typically used to achieve a very practical goal more efficiently. But what happens when you enter a world in another realm? A world of pretend and imagination, devoid of the constraints of typical cartography? Well then you transcend the confines of practical maps and enter the delightful land...

Pollinate Ep. 5- Christina Conklin & The Atlas of Disappearing Places

| 04.14.22

Time. Space. Salt. No, these aren't a new take on necessary elements for cooking a delicious meal. They are some of the core themes that artist and author Christina Conklin explores in her work. Whether it's patiently waiting for saltwater to evaporate and form intricate patterns on a concrete floor or painting maps of climate change data on dried sea lettuce, she is inspired by the ocean and all the elements and organisms within it. In this episode, Christina discusses her book The Atlas of Disappearing Places and the beautifully painted maps that accompany insightful and thoroughly-researched stories that elucidate the intimate connectivity between humans, the ocean, and the planet we all call home.

Working & Designing with Spatial Data

| 10.13.16

Late this summer, 10 people gathered at Stamen Design’s studios to learn how to design and work with geospatial data on the web. What we set out to do We all set aside 4 hours of a Sunday afternoon to get a hands-on introduction to the leading tools for web based mapping visualization. With a repo full...

An ode to d3.js projections

| 05.30.16

When it comes to making maps online there are many tools available, but they all have one thing in common: Geographic coordinates go in and a two-dimensional image comes out. Converting from geographic coordinates (longitude,latitude) to pixel coordinates is accomplished via a map projection. Most of the tools made for online map making focus on facilitating the navigation...