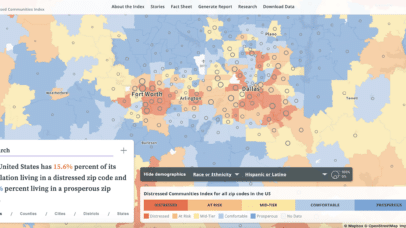
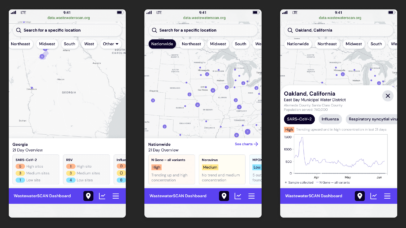
blog/Design

How the Vast Spectrum of Data Fuels Your Data Visualization Project

| 02.03.23

One of the biggest myths about data visualization is that you have to have the “right” kind of data to tell compelling visual stories.  But, when data visualization only focuses on leveraging numerical facts, it becomes inherently limiting in ways that science, research and discovery were never meant to be.  There’s a better way.  Researchers...

the yellow brick garden of forking paths

What is Full Stack Cartography?

In a series of presentations and podcasts over the past year, Stamen cartographers Alan McConchie and Stephanie May have been exploring the world of contemporary online map making, and how Stamen Design has developed a uniquely collaborative way of working to build maps for a wide range of clients. In this short recorded conversation, we...

Make your own globe-spanning Jack-o’-lantern

Look at this fun thing. You can carve a pumpkin on the globe! I can’t believe it. Isn’t it fun? It is. I am fun.Here are a few more. If you want to be fun too, try it at stamen.github.io/pumpkin. Also what is fun is that your carving is stored in the page URL.  If...

Pollinate Ep. 11- Amira Hankin & Designing Without Rules

| 10.17.22

The intersection of the physical world and human consciousness is a playground for designers like Amira Hankin, who know how to leverage both to influence the behavior of an observer. Trained in visual arts and biology, Amira is a lead product designer at Stamen and one of the minds behind Stamen’s award-winning project 12 Sunsets....

More ways to make your maps go Dark Mode

The other day at Stamen we were talking about a recent post by esri’s John Nelson called “Create a Light or Dark Version of Any Map in Two Seconds” using ArcGIS Online Map Viewer. So of course we were wondering how we could do the same for Mapbox GL styles. We often have to design...

Visualize a cross section of your map with Chartographer

| 08.16.22

At Stamen, we work with clients to improve their interactive cartography experience, frequently building full basemap solutions for large corporations who have very specific needs and exacting standards. Doing so means wrangling complex global data into beautiful, performant maps, controlled by elegantly written stylesheets. Most web maps have a near-endless amount of detail that can...