
In the latest episode of the Stamen Pollinate podcast, Stephanie May talked with cartographer Jeffrey Linn about his fascinating series of sea level rise maps and about the concept of “speculative cartography”. Maps that show familiar coastal cities flooded by water are viscerally terrifying and visually compelling, but as cartographers we often struggle with the limitations of maps like these to tell the full picture of the coming impacts of climate change, or to accurately communicate to the public the complexities and uncertainties of when the seas will rise this much and where the impacts will be most felt.
In this short conversation between Stamen Lead Cartographer Alan McConchie and Lead Geospatial Developer Damon Burgett we discuss these questions of how we communicate context and uncertainty, how we enable users to interact with hypothetical scenarios in our maps, and why sea level rise maps have such an enduring grasp on our imaginations.
Audio:
Transcript:
Alan McConchie (AM): Hi, I am Alan McConchie, lead cartographer at Stamen Design.
Damon Burgett (DB): And I am Damon Burgett, lead geospatial developer at Stamen Design.
AM: And we just listened to the podcast with Stephanie May interviewing Jeffrey Linn from Conspiracy of Cartographers all about speculative cartography and sea level rise. And there’s a really interesting phrase came up in that podcast that was attributed to you, Damon referring to sea level rise maps as the charismatic megafauna of climate change mapping. And that sounds good, right? Is that good? Is that a bad thing? I don’t know.
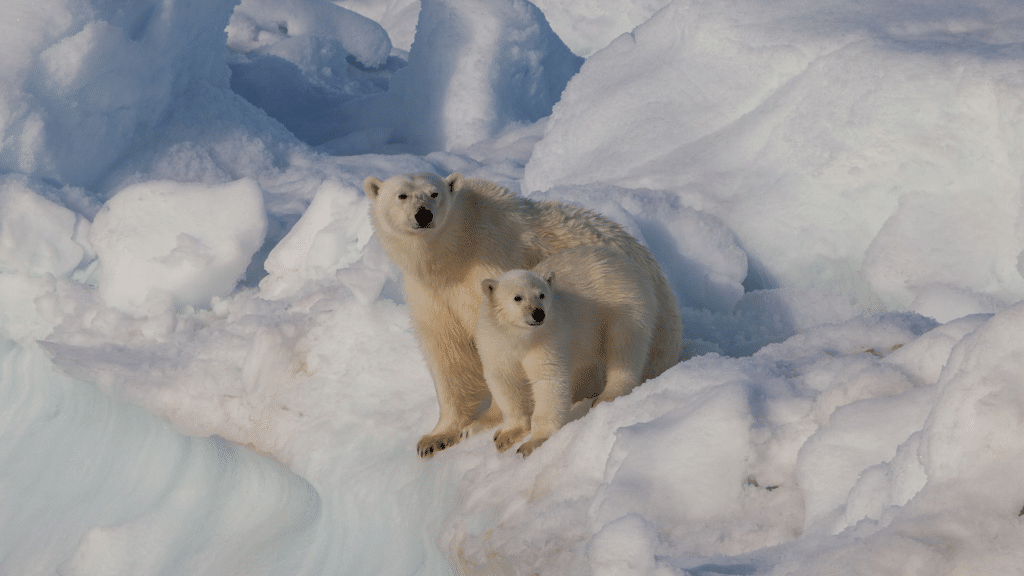
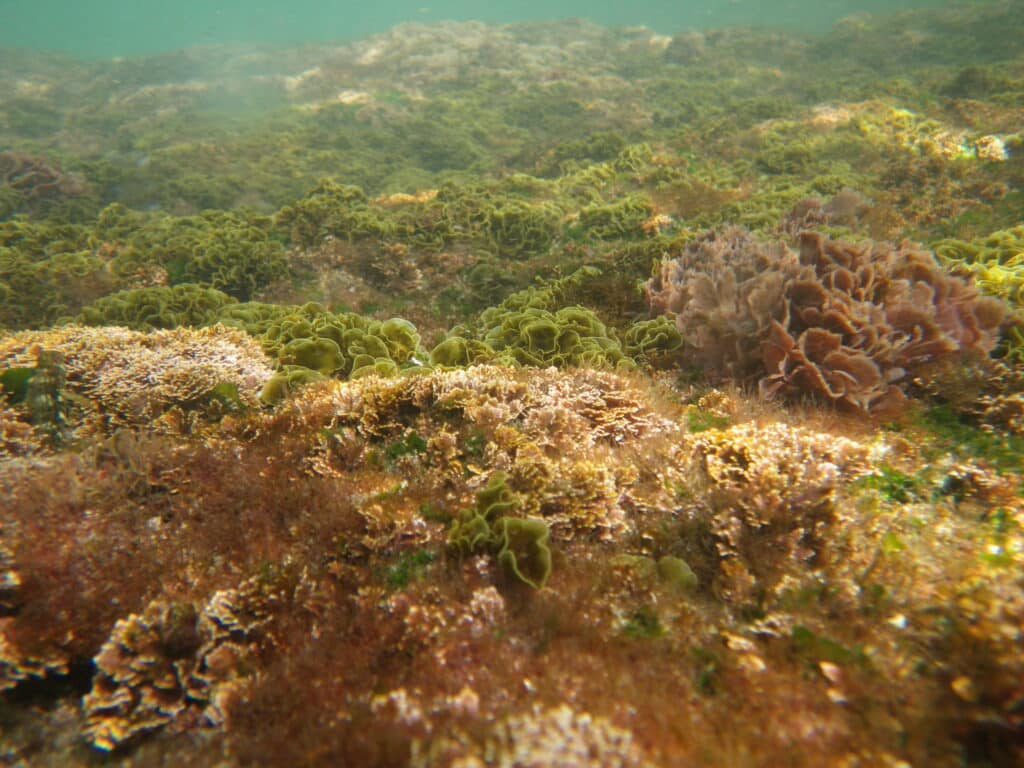
DB: That term comes from conservation biology. And really sort of describes the fact that in communicating the idea of conservation, it’s a lot easier to make the case with this idea of big, furry, cute mammals, like polar bears. So polar bears are obviously important to the ecosystem and are a keystone species. And they sort of are the very top part of the ecosystem. Without them they’ll fall apart. But the ecosystem is constructed of a ton of other different parts of things, all the way down from algae and bacteria all the way up through the food chain. But why it’s charismatic megafauna is you can’t put bacteria in an ad or you can’t put algae on a billboard and say save the algae. It’s a lot easier dialog to communicate if we talk about it in terms of these animals that people can relate to and can create interest in. That’s what the term comes from.
And I think it’s a similar thing with sea level rise in a few different ways because these are the sort of facets of climate change that people can most clearly relate to, right? The sea is rising, the water level’s here. But they don’t really tell the whole story. But at the same time, they’re a useful tool for communication. So there’s always this sort of tension.
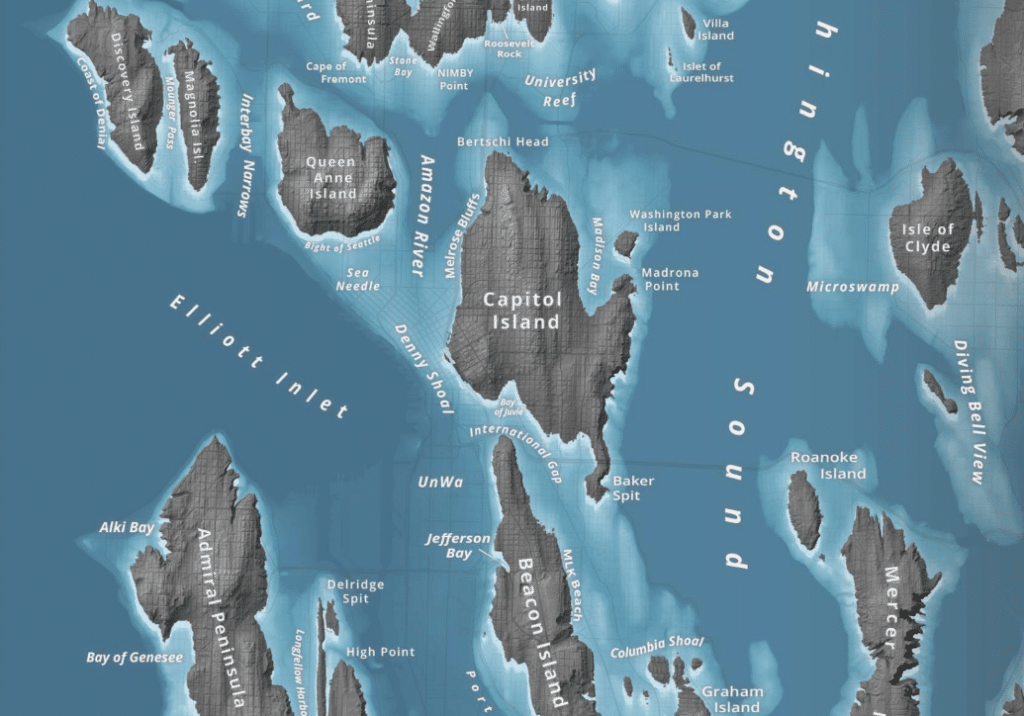
AM: Yeah, I mean, it feels like there are so many sea level rise maps out there. Well, we’re map-makers. We see a lot of maps. So it feels to us like there are so many. And recognizing that there are other things that need to be mapped as part of the climate crisis conversation. But also when we’re making these sea level rise maps, we try to find a new angle on them. Jeffrey Linn’s work is amazing. I think because of a lot of it is the humor in terms of the naming, he puts on these places, that also brings it home, makes it more humanized when you see your neighborhood has a new name because it’s become an island, and you kind of think, yeah, well, people probably would have to rename some things.
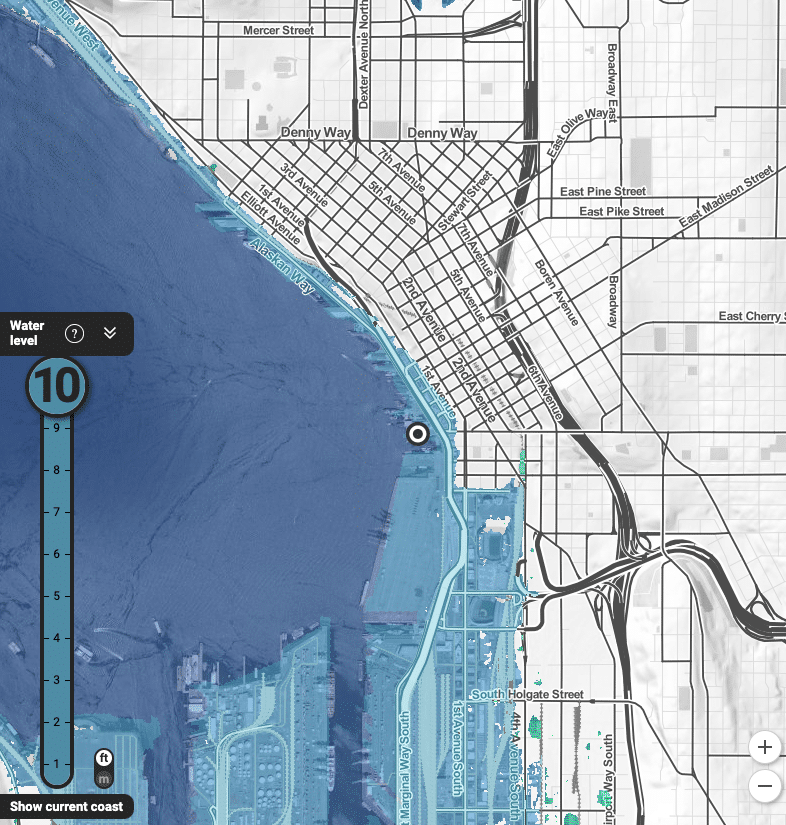
And at Stamen, we’ve done some sea level rise mapping too. We’ve had an ongoing series of projects with Climate Central called Surging Seas and one of the things we tried to do differently in that was flip what you normally emphasize in the sea level rise map, where instead of all the things that get flooded, just get covered with blue water. We had it so that places that flood actually are where you start to see the satellite imagery and that the land that’s still dry is more of a plane, grayscale map, trying to change the focus on what is actually getting flooded.
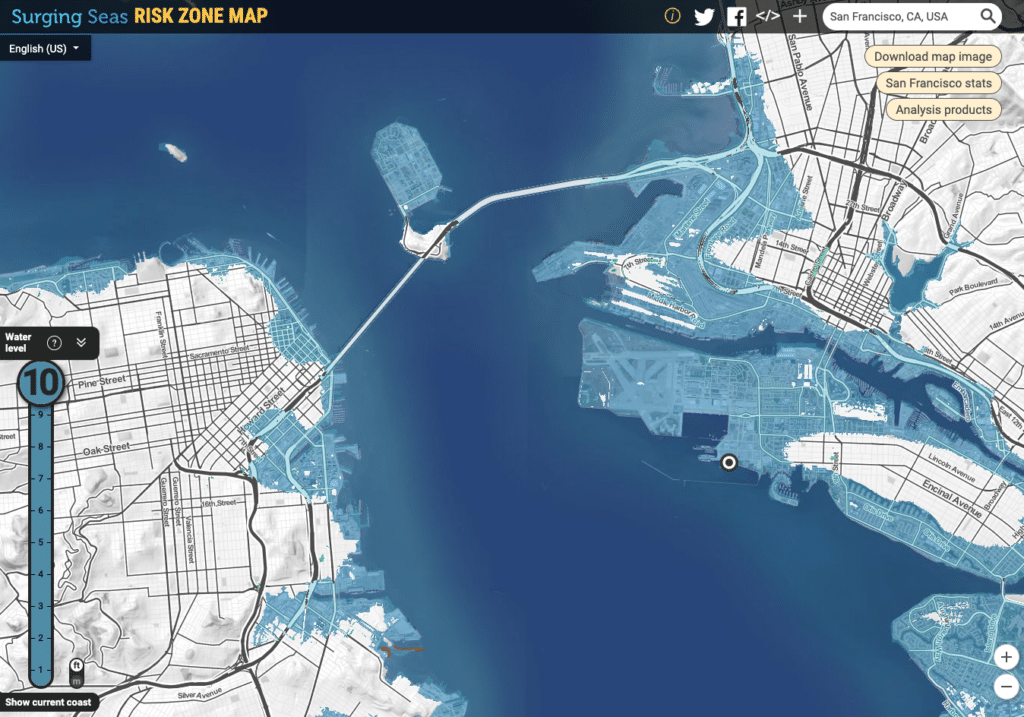
We do a lot of work and this is an old technology now almost 10 years ago probably when we first made the first versions of that. We wanted to have a slider, a little control that would let people adjust the sea level themselves and see how the map changes. But now there’s new ways that we might be able to do that and even working on some new techniques for that even recently.
DB: Yeah, that’s right. And I think around the same time y’all were working on Surging Seas, I was making sea level rise maps for the port of San Francisco. They were interactive in the same way. And I’ve always really been interested in providing people with a tool to sort of play with the data themselves. These terrain datasets are super rich. And beyond communicating the impact of sea level rise, I think it’s just a great way for people to really explore the landscape from a different lens.
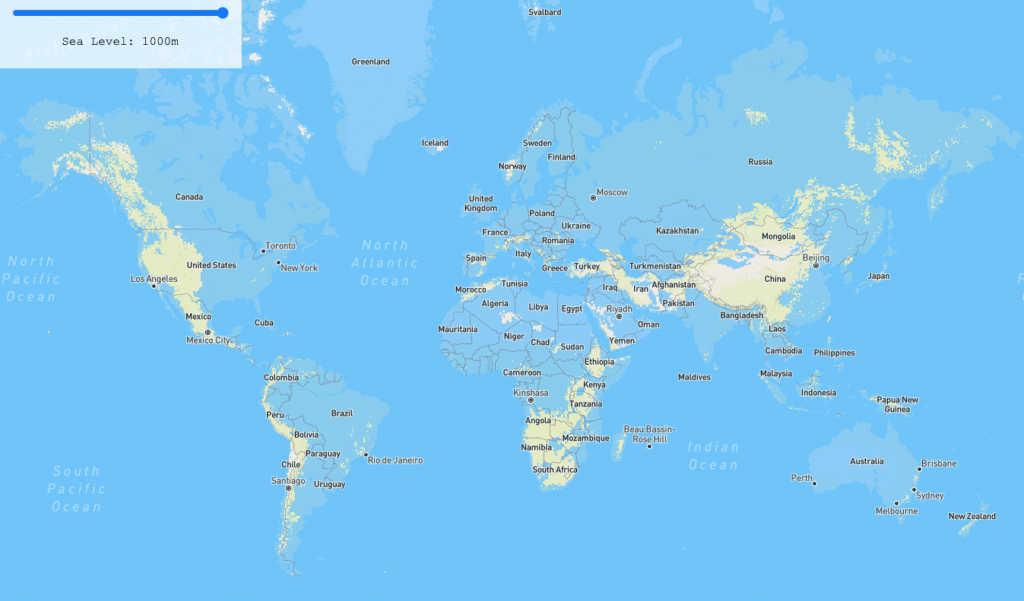
But yeah, recently I was experimenting with some new techniques to actually visualize this in a much more performant way. So we implemented a custom texture layer that allows you to really performantly raise and lower the sea level. This actually uses the computer’s GPU and what’s called a shader to do this very, very quickly and efficiently. And like Jeffrey Linn’s maps, it allows you to, I think, raise sea level up to one kilometer, which is obviously ridiculous in any climate change scenario. But it’s interesting nonetheless.
And I think that is for me the really big tension that we’re always trying to sort of address. I always say this about our projects and the work that we do is—sometimes it’s said that people don’t like complexity, people can’t understand complexity. We’re working with these datasets that are super complex, super hard to understand. I’ve always thought that it’s not that people can’t handle complexity, what they need is a framework in order to understand that complexity. They need a lens via which through to view the data. And as part of what we do at Stamen is help to construct that. What the sea level rise maps and charismatic megafauna, those kind of things, really do are sort of focus on one part of the issue that really helps to describe the problem in the most clear way possible. But, of course, they’re leaving out a whole bunch of other things on the side. And so, it’s always a balance between that simplified reductionist approach to a more holistic approach.
I’ve always thought that it’s not that people can’t handle complexity, what they need is a framework in order to understand that complexity. They need a lens via which through to view the data.
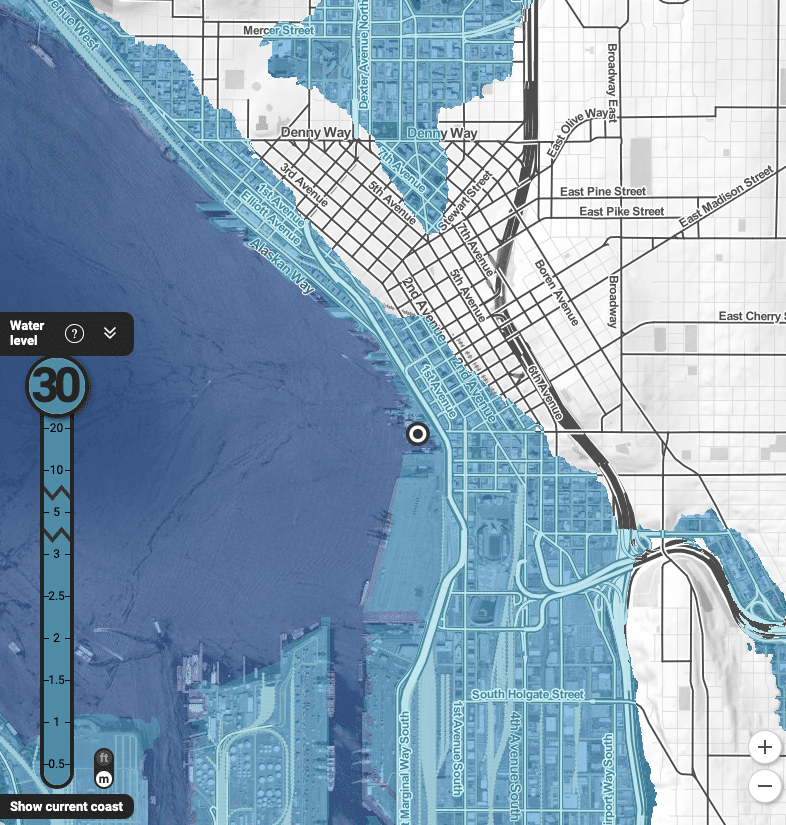
AM: Yeah, I think that how much we kind of put rails on the experience when we make these interactive tools is always a challenge. It’s always an interesting question of how much do you let people turn the knob up to 11, right? The Surging Seas maps, I think they were really focused on more immediate threats, kind of very close time horizons and I think it capped out at 10 feet sea level rise. What was interesting though is that you could switch it to metric view and go to 30 meters. So if you really wanted to crank it up… I always wonder if it’s just because they didn’t trust Americans who use feet to not exaggerate it.
But yeah, your tool where you can go up to 1,000 meters to sea level rise, we see maps like that, and it’s an interesting thought experiment, but that would never happen because there isn’t enough water. Even if you melted all the ice caps, you couldn’t flood the earth that much. So do we see a bunch of comets land or something to bring all that water?
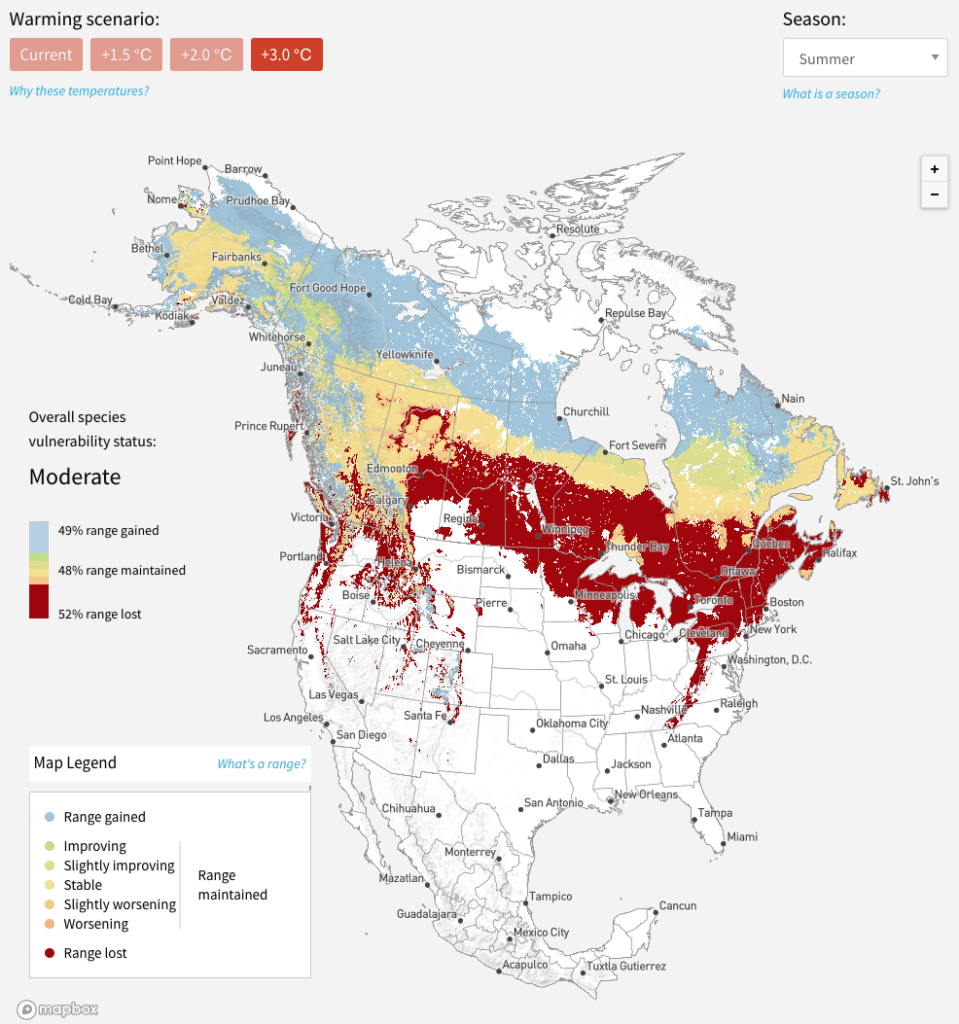
It also makes me think of trying to show what aspects of these scenarios we’re more or less certain about. It makes me think of another climate change project we did with the Audubon Society, where we worked with their GIS experts to create these models of bird species ranges, where their range would likely be in the future under different global warming scenarios. And some of the early versions of that were somewhat naive. They just assumed, based on temperature, a bird that likes this temperature is going to be found up in Alberta instead of in Kansas. But the problem is they might not actually find the other ecosystems that they need, the ponds where they would need to have their nest. There’s the hypothetical chance that they could find somewhere they can live there, but there’s no guarantee of that.
So as we did more revisions of the project with Audubon, we realized we needed to really emphasize more the threats rather than the opportunities. So we used a lot of color schemes where the lost territory would be in red to really show that this is a known scenario that this part of the ecosystem will be gone. And the possibilities of where, if that bird species is lucky, they could migrate to were really pale to communicate how much you should trust these different hypothetical scenarios.
DB: That makes total sense because when you’re building a computer model or when you’re building a model for academic paper, you can put all those caveats in the text to paper and the assumption is that other scientists would read them. But when you’re building a web page, an app, it’s hard to expect users to really, I guess, read the fine print. So you need to do that in a way that’s intrinsic to the tool.
AM: And also thinking about just the data that we have at hand is another big question. We see a lot of sea level rise maps because terrain data is relatively easy to find good quality. A lot of the other metrics we want to work with are harder to locate and even if we wanted to find them, it would be maybe that some of that data doesn’t exist. And that’s another way we work with our clients. We really want to be telling the story of the data. Whatever they bring to us, we want to make sure that we get into that data and work with it. But we also want to make sure we’re not constrained by just what data is available, and let that lead us. We need to think about what would be the right data, where would we find it? How do we really answer this question even if the data at hand is maybe not the most suited to that problem? So that’s another way we’re always working with the speculation based on what data can tell us.
We really want to be telling the story of the data. But we also want to make sure we’re not constrained by just what data is available, and let that lead us. We need to think about what would be the right data, where would we find it?
DB: Yeah, it’s really important to sort of perform, I guess you could say a virtual discourse analysis, of the data and tools that we’re working with. Because much like language and the way we use it is going to inform our worldviews, the data that we have, and the tools are going to inform what we create. And I think it’s really important to take sort of a critical view of those and understand how they may be biasing what you’re creating.
AM: Absolutely. Couldn’t have said it better myself. Thanks, Damon. It’s been great talking with you about this. And yeah, everybody, if you haven’t listened to that podcast, go check it out on our blog or read the transcript and let us know what you think.
DB: Thank you, Alan.