Skip to content
Helping people find and tell more beautiful stories with data
Work
Services
Custom Data Viz
Interactive Maps
Full Stack Cartography
About
Our Story
People
Press
Blog
Contact
Blog
Musing on data viz, map making, and everything else from
Stamen Design
Projects
Podcast
Process
Latest
Conversations
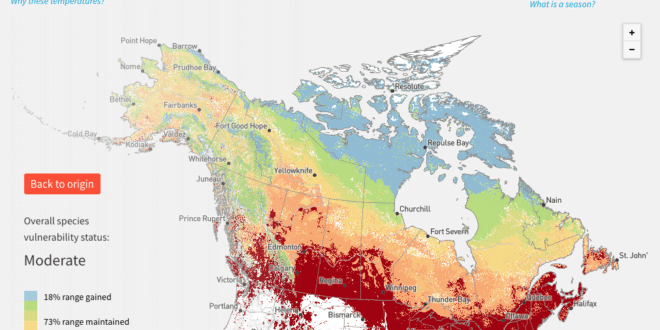
Survival by Degrees: How We Built It
Kelly Morrison
| 01.27.20
Conversations
Survival by Degrees: How We Built It
Kelly Morrison | 01.27.20
Process
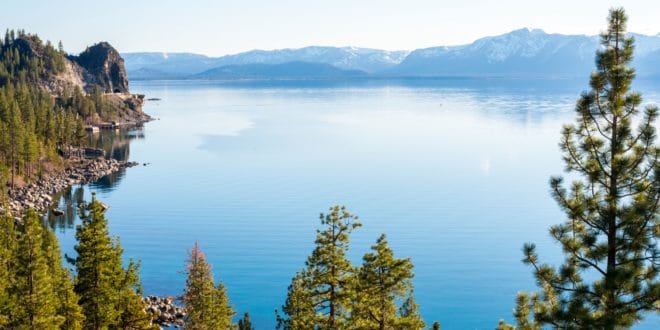
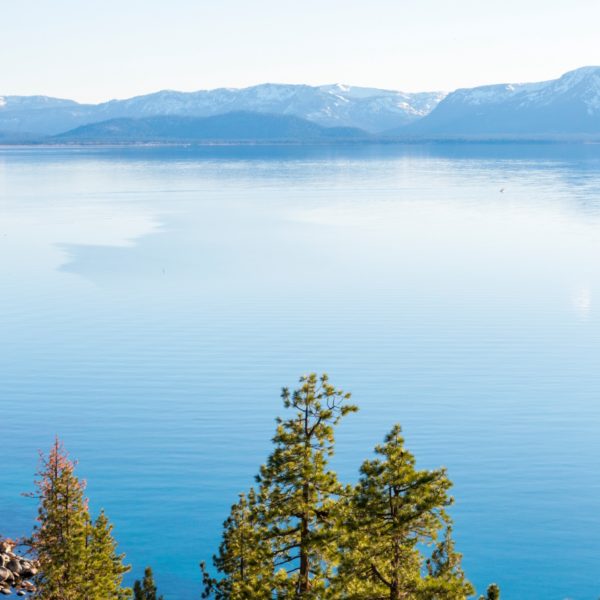
Environmental Data Visualization: Many Dimensions of Lake Tahoe
Nicolette Hayes
| 01.21.20
Process
Environmental Data Visualization: Many Dimensions of Lake Tahoe
Nicolette Hayes | 01.21.20
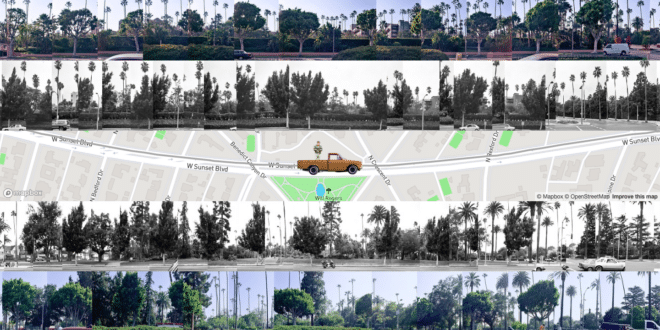
Roundups
2019: Data visualization projects by Stamen Design
Eric Rodenbeck
| 01.08.20
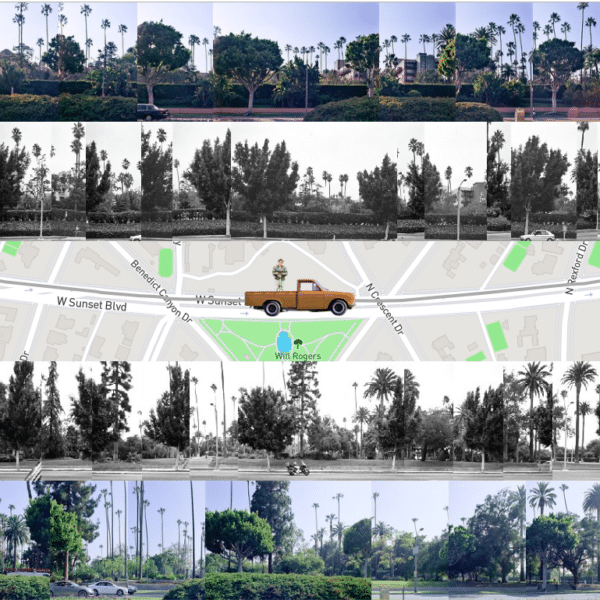
Roundups
2019: Data visualization projects by Stamen Design
Eric Rodenbeck | 01.08.20
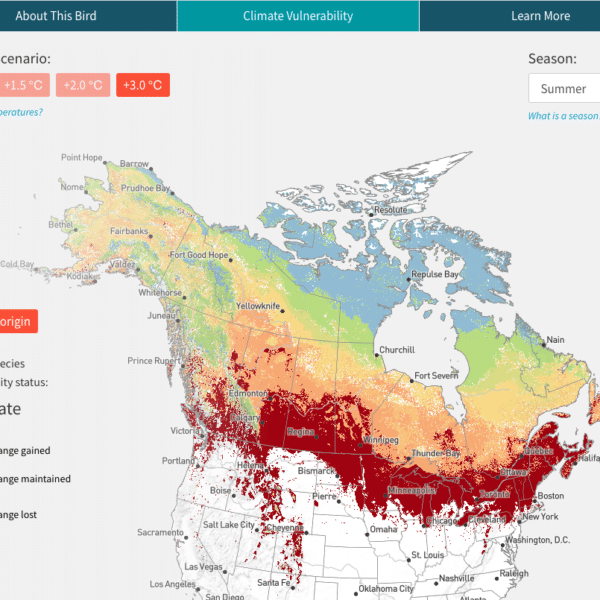
Process
Exploring the impact of global warming on North American birds with Audubon
Kelly Morrison
| 12.27.19
Process
Exploring the impact of global warming on North American birds with Audubon
Kelly Morrison | 12.27.19
Process
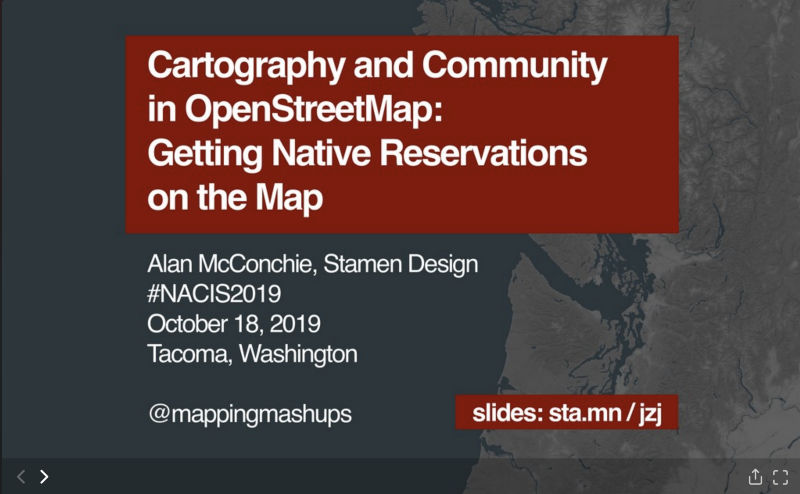
Getting Native Reservations on OpenStreetMap: Transcript
Alan McConchie | 12.18.19
Process
Video: Getting Native Reservations on OpenStreetMap
Alan McConchie | 11.01.19
Events
Our next Data Visualization Foundations class will be this November!
Alan McConchie | 10.04.19
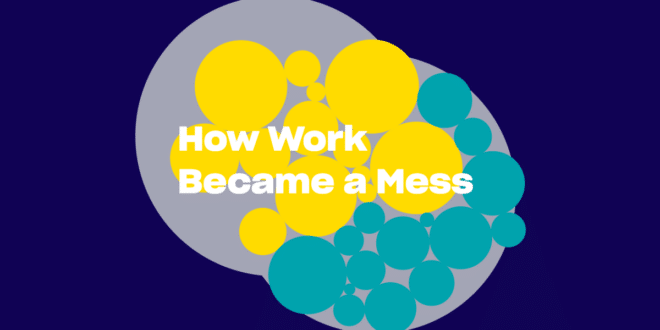
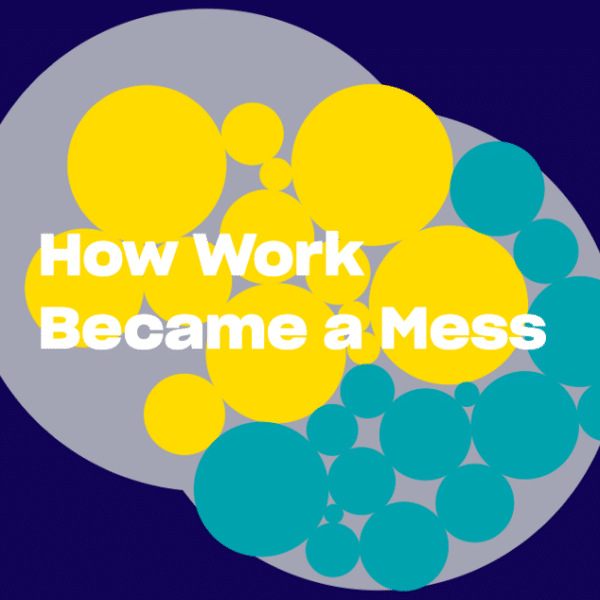
Process
Telling the Dropbox story of “How work became a mess
Kelly Morrison
| 10.01.19
Process
Telling the Dropbox story of “How work became a mess
Kelly Morrison | 10.01.19
Conversations
Visualizing XYZ data with Alan McConchie, Stephanie May, and Sarah Fortune.
Eric Rodenbeck | 09.20.19
Process
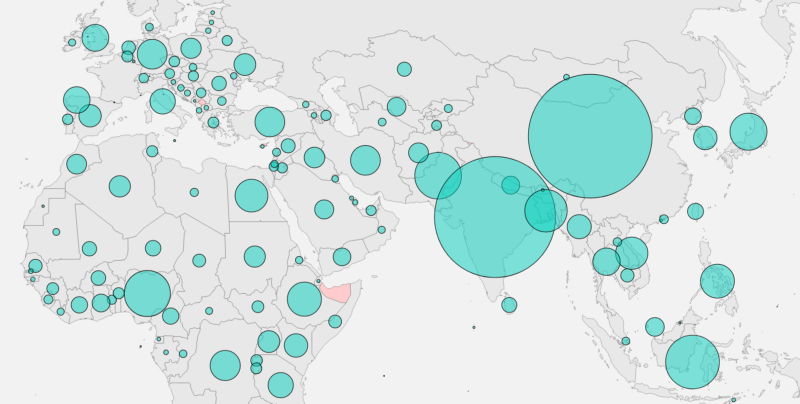
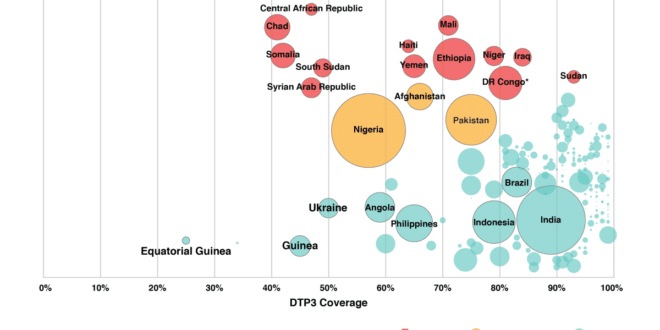
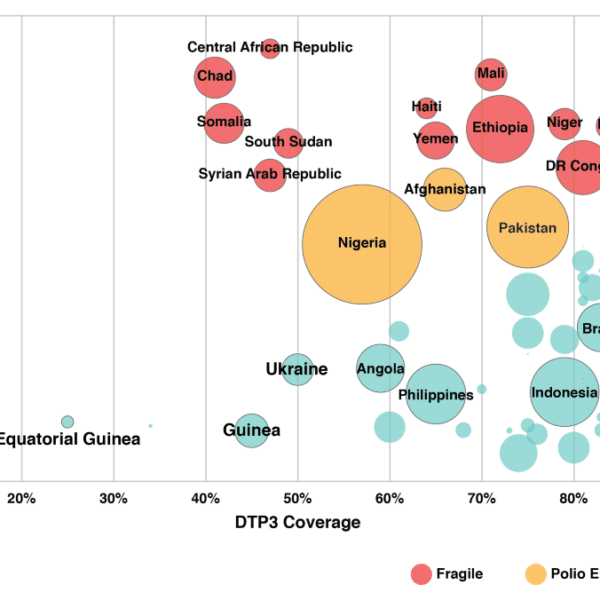
Visualizing Global Immunization Rates with The World Health Org, 2019
Alec Burch
| 08.19.19
Process
Visualizing Global Immunization Rates with The World Health Org, 2019
Alec Burch | 08.19.19
Close
I agree
Close
Scroll to the bottom to agree