
There’s a story behind everything; it’s that special context that flavors your experience when reading your favorite book, poring over your favorite map, or listening to your favorite podcast. At Stamen, we love talking about process, working openly, and, you guessed it, telling stories. We want to share the story behind Pollinate, the Stamen podcast: how it started, what went down in its first year, and where we hope to take it.
How It Started
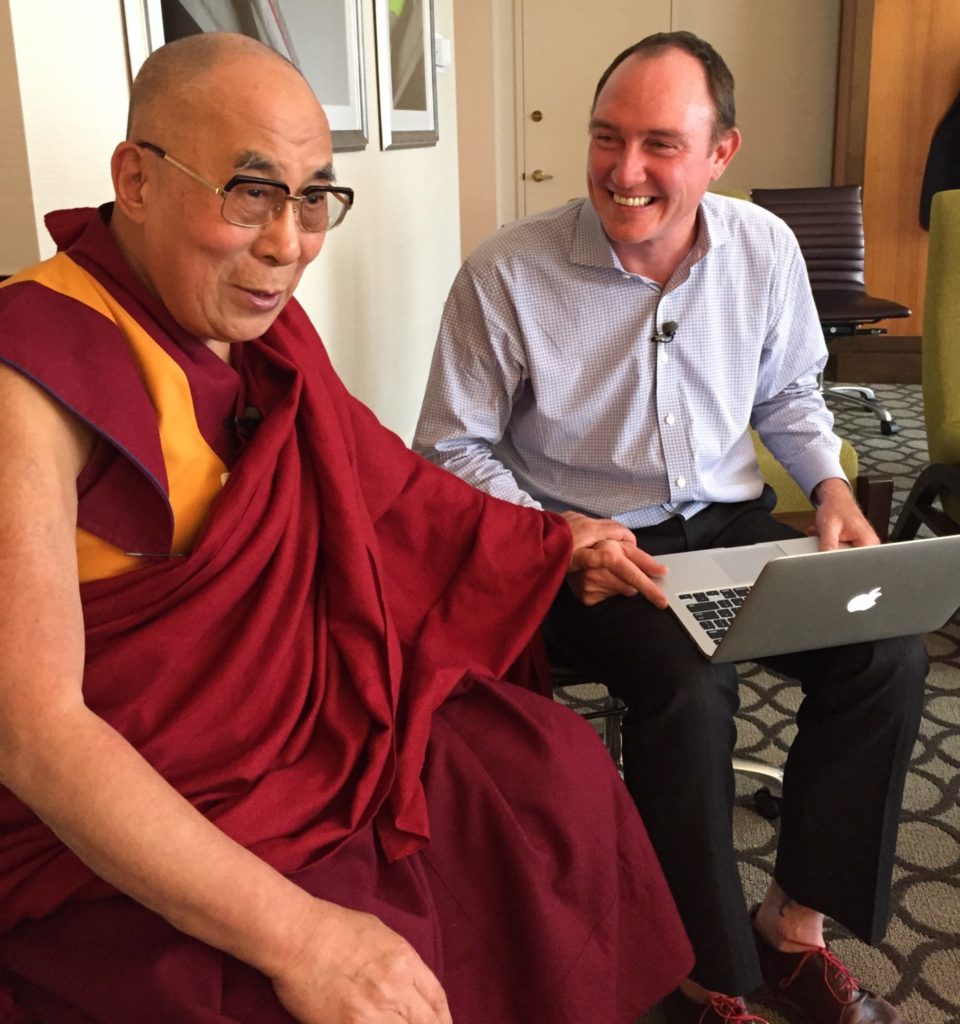
I, Ross Thorn, am a cartographer by trade. I was a few months into contracting with Stamen, working solely on designing basemaps for a major client, when I was paired with Eric Rodenbeck for a casual virtual coffee chat. [The team uses a Slack bot to stay connected when working remotely.] Of course, I had to let him know that I don’t drink coffee, because I’m a pompous bastard, but that’s beside the point. I was pretty nervous at the time; I had only been in the workforce for two years and had heard the praises of Stamen’s maps from professors and professional colleagues for as long as I was learning about maps. I had seen pictures of Eric showing Stamen’s work to the Dalai Lama. And now I was working with them and about to have a call with the founder of the company.
If you’re at all more seasoned than a cheap rotisserie chicken, you might roll your eyes at my naivety. And for those of you who are a bit newer in the industry: everyone in your field—even those above you in the org—is just a person and you deserve to be where you are. Plus, Eric is a peach and quite down-to-earth, so I quickly realized that I had nothing to worry about.
We hit it off in our video call, talking about games and maps (because sometimes I’m insufferably that guy) and how we both found our love of mapping through playing in our youth. We talked about science fiction and how it has the freedom to push boundaries and how he wants Stamen to do the same. He shared with me the official Stamen marketing plan and there was a section titled “It’s Science Fiction Time,” which heralded a paragraph about aligning Stamen’s work and brand with the “cutting edge”. Towards the end of the chat, Eric said something to me that I’ll never forget:
“I wish we had recorded this conversation.”
I beamed with pride. While I had shaken off the nerves shortly into the call, it still felt really good to hear that, especially as a contractor struggling with imposter syndrome. After hanging up, I reopened the tab with the marketing document and saw another section that looked like this:
Possibly:
- Podcast
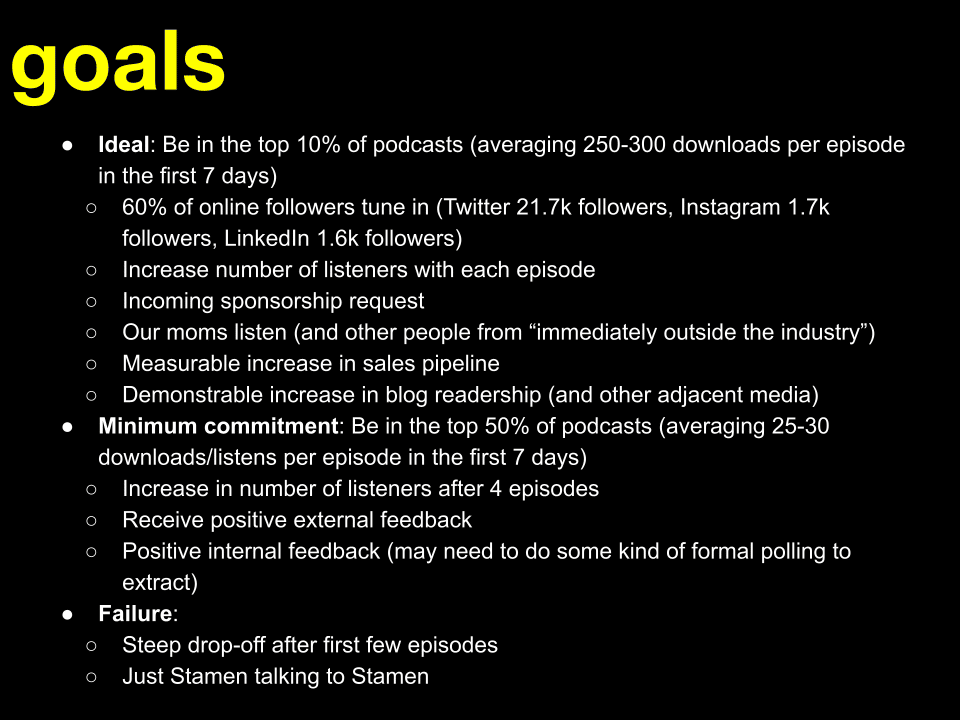
And it all clicked right then. I wanted to be more involved with Stamen and offered my assistance to Eric and the rest of the team to help make this podcast a reality. I already had audio equipment that I bought for my musical endeavors and a bit of time to learn how to actually use it. We were all on board and started to tease out the logistics and criteria for success. None of us had ever podcasted before, so we weren’t quite sure what a successful endeavor would look like. Thankfully there are a myriad of resources out there that helped us distill the list below for different levels of success for the podcast. Breaking the levels out is something we do with all of our projects and is something that I really appreciate; it’s great to shoot for the moon and aspire to be your best, but it’s really important to recognize all forms of progress and the little wins that help you get there. Our design director, Nicolette Hayes, was crucial in making this happen, and was the wind beneath the wings of this whole endeavor.
With our goals in mind, we wanted to refine our vision for the content. We figured we’d record a few episodes internally at Stamen, with the idea to branch out and talk to people who do incredible stuff in our industry. We initially thought of releasing bi-weekly, but quickly pulled back to a monthly cadence after realizing the amount of work that goes into each episode. The biggest task then became figuring out what we actually wanted to talk about.
While the maps, data visualizations, and design are important, I wanted to focus on the people. One of my favorite parts of any English class I’ve taken is the practice of examining a literary work through the contextual lens of the author. Who were they? What might have inspired them to write this story? AND WHY ARE THE CURTAINS IN THE STORY BLUE?! I know that every piece of art I make—be it a map I’m designing, a song I’m writing, or a miniature I’m painting for DnD—holds something of myself within it and there’s a connection to my choices and stylings waiting to be explored by an observer. And that’s what I wanted to do: reveal the human beings behind the curtain who are making cool stuff and allow the podcast listener to make connections between the creator and the creation. As I said, there’s always a story behind the scenes.
So we started recording! Eric and I made the pilot episode on The Atlas of Emotions, a seminal Stamen project that I could tell Eric was proud of and had talked about before, so it would be easier for us to discuss. I also didn’t want to be the only voice guiding conversations. Thankfully, Nicolette and Amira Hankin bravely stepped up to the role. They were both instrumental in workshopping ideas for the show and their assistance in hosting helped set the standard of having multiple voices in each episode.
A few weeks before we launched, we had 4 episodes recorded, but we were still figuring out some details like release schedule, ideas for external guests, and how to promote it. We had good ideas, but a lot was in flux and we wanted to ensure this was set up for success.
But folks, we gotta talk about the name.
“Pollinate” was one of the first ideas I came up with. Our company is named after the pollen-producing part of a flower and, much like pollen, our podcast is meant to spread ideas on the digital wind to listeners around the world. We kept using “Pollinate” in any references to it, because we also didn’t have anything better. Our scheduled launch was nigh and we needed a logo. So I did what anyone with bad taste would do and removed the vowels and added a number to create “PLN8,” which totally wouldn’t confuse anyone and slapped it together to make the logo below.
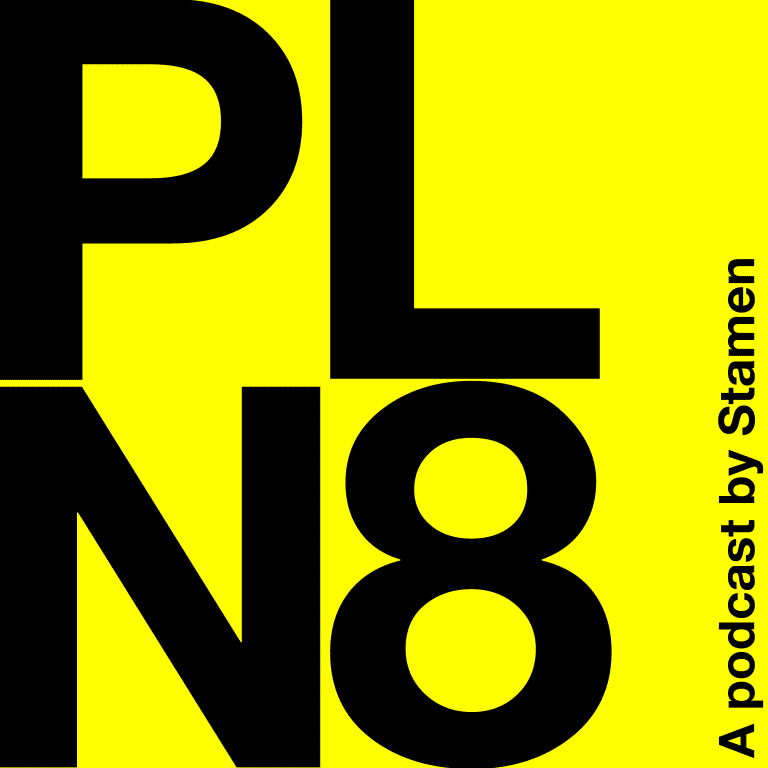
In all fairness, this logo would look great on a mug, which should be criteria for any podcast logo. Anyways, I talk more about this with (literal) grave humor in my NACIS talk about the podcast. If I take anything from this, I’m flattered by how much trust my team has in me.
But with episodes recorded, an adequate logo, and a list of expectations we launched our first episode.
Our First Year in Podcasting
Honestly, it went really well! Our first few episodes exceeded our minimum success requirements and we saw an increase in listenership with each release. We kept releasing from our backlog of episodes as we reached out to people outside of Stamen to be on the podcast. Through cold calls and connections, we curated a guest list of brilliant data storytellers, cartographers, and designers.

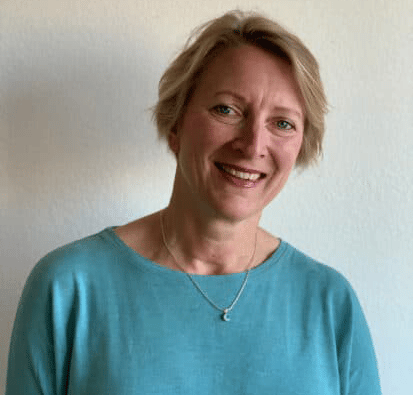
We talked to some amazing people about some truly stunning works in cartography, data visualization, and design: Christina Conklin joined us to talk about the incredible climate change maps she painted on dried sea lettuce, Shirley Wu talked about the amazing projects she made while learning new ways to work with data, and Andy Woodruff helped us show if we were in the right for complaining about Daylight Saving Time depending on where we live. The list goes on!
One of the biggest challenges of this endeavor is that we talk about visual media in an audio format. To help with this disconnect, we write an accompanying blog post with each episode which holds all the visuals discussed in the episode.

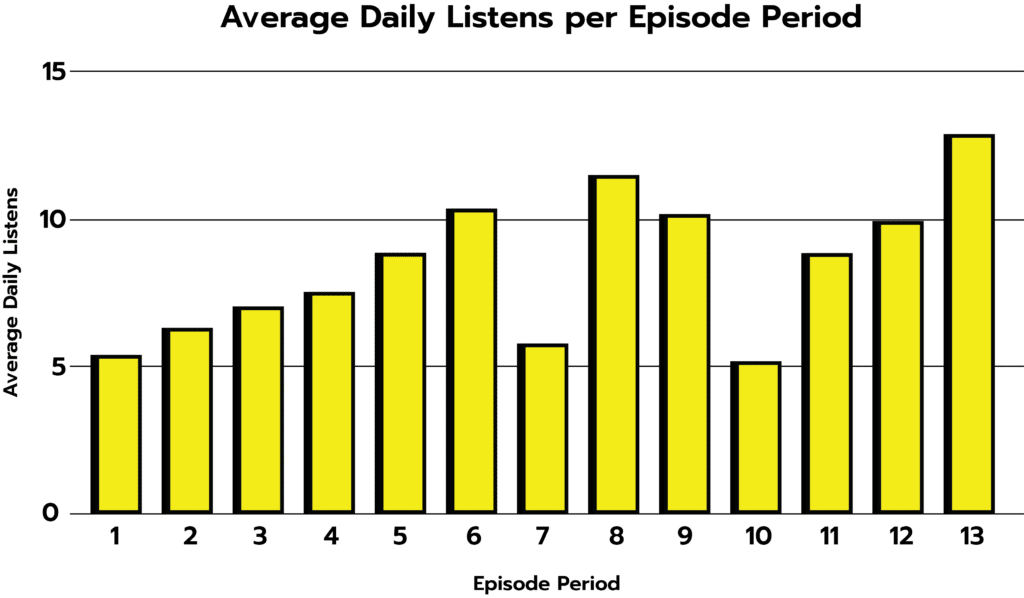
With each episode, it became apparent how important growth was as a metric. It was slow, but that was to be expected with a monthly release cadence. One of the main threads in our criteria research was that consistency leads to growth. I wanted to find out more about PLN8’s growth through the episode data I got from Anchor, our hosting and distributing platform. I may only be a map guy, but we’re a data company at our core, so I began finding all the meaningful ways to interpret the stats.
The data we have is merely the number of daily plays for each episode. But it’s how we group those plays for a single episode and in the context of other episodes that really reveals some more interesting patterns. A quick example is that we release on a monthly basis, but not all months are the same length. So while we can look at the number of plays a new episode has in the period before the next one launches (we internally call this timeframe the “episode period”), we can get some more meaning out of looking at the average plays per day and alongside the number of days in that period.
There are a few other metrics we’ve learned to monitor that I won’t cover, but they’re similar. Considering multiple angles of the same data helps us define our benchmarks. We’re continuing to evolve our expectations as we learn more about this medium and our place within it. But in short, we had significant growth and are keeping that momentum rolling in our second season!
Looking Ahead
And with the launch of season two, we took the opportunity to rebrand! We kept our spoken name, but revamped our logo to be less confusing with more vowels and less numbers. I’m proud to formally reveal the new logo for Pollinate!
We’ve also done another cosmetic change that you might have noticed on our socials. We’re including video of all our guests in our promotional clips from each episode. Again, we want to keep the people at the forefront of these conversations and it’s helpful to put a face to a name and project!
As the saying goes: if it ain’t broke, don’t fix it. And so far (knock on wood), we have nothing to really fix as far as our success criteria is concerned! We’re going to keep prioritizing the people behind the projects and are actively trying to include a more diverse array of voices in our guest list. We’ll keep experimenting, listening, and monitoring as we release more episodes to help us grow and share these conversations with a broader audience. If you’d like to help us do that, consider submitting a review for Pollinate wherever you listen to us and share the show with anyone who might be interested.