blog/Cartography

Stamen x Stadia: harnessing modern vector cartography

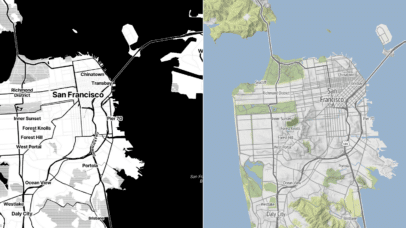
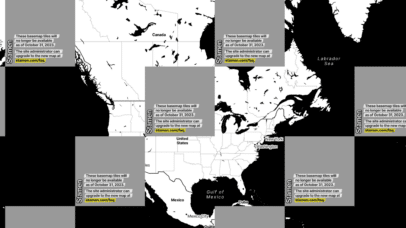
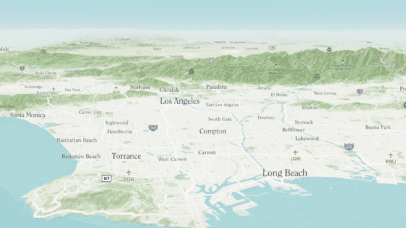
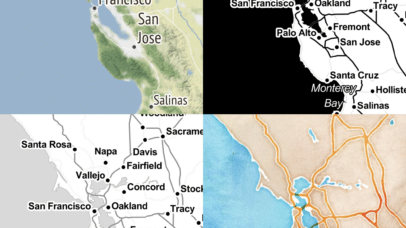
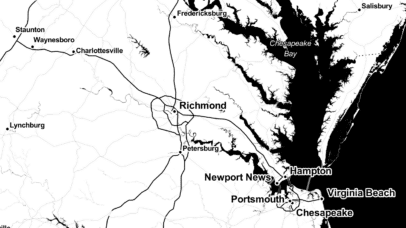
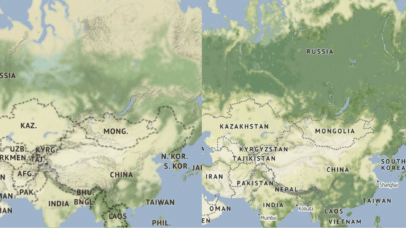
Not long after Stamen created our first Toner, Watercolor, and Terrain styles, a new technology came along: vector maps. Though it still used the paradigm of dividing up the world into map tiles, vector maps divide up the data into pre-processed chunks instead of the map itself. In vector cartography, the map is drawn dynamically...

Stamen x Stadia: familiar maps, brand new data

Since 2011, Stamen has provided basemaps built upon OpenStreetMap (OSM), but it’s been several years since we updated the underlying data in them. We received a grant from the Knight Foundation a few years after their release to refresh Toner and Terrain, but it’s no small feat to keep a worldwide map updated with the...

Stamen x Stadia: the end of the road for Stamen’s legacy map tiles

| 09.18.23

As you may have heard, we’ve partnered with Stadia Maps to create updated and modernized versions of our venerable basemap styles on Stadia’s infrastructure. You can read more about the announcement here and learn about some of the amazing features in the new maps in our recent blog post “Here Comes the Future of Stamen...

Dreamy, aspirational cartography with Spherical

| 08.10.23

Earlier this year, Stamen collaborated to design a custom branded basemap with our friends at Spherical, a creative technology design and integrative research studio supporting projects regenerating the health and integrity of Earth’s living systems. In partnership with ARLA, Spherical supports community workshop facilitators with their Living Infrastructure Field Kit, a space to explore the...

Here comes the future of Stamen Maps

Since 2011, Stamen has provided free custom-designed basemaps for the whole world, for anyone to use, for any purpose. Long after other map providers went out of business, started requiring API keys, or charging for usage of their maps, we kept providing our maps for free. Why did we keep doing it, years after others...

State of the Map US 2023 logo

State of the Map recap

| 06.29.23

After three years of limited conference attendance, we had a blast at State of the Map US this year! The conference was held in Richmond, Virginia, so a long trip for those of us on the West Coast, but close to home for others, now that we are fully remote. It was great to come...

The Data Visualization Discovery Phase Made Clear, Clear, Clear, in Business Language!

| 06.12.23

Mention the term “discovery phase” in a room full of product managers, analysts, executives, entrepreneurs, or developers, and you’re certain to garner myriad responses: everything from nods of agreement and appreciation to rolling eyes and exasperated sighs. In fact, in the design and development process of digital products, there’s perhaps no phase that is more...

Stamen at State of the Map

| 06.07.23

This week, Stamen will be attending the State of the Map US conference in Richmond, Virginia! We’ve been attending these OpenStreetMap conferences (either the international State of the Map or this US-based version) for over a decade, and it’s always exciting to feel the energy of this lively community of open source mappers. The OpenStreetMap...

Level Up Your Navigation: Inside Stamen Design’s Route Simulator

If you’ve been following some of our recent posts about maps and gaming, perhaps you’re wondering, what lessons on spatial navigation can we take from game design and apply to navigation in the real world? The answer is that the visuals that accompany the driving directions you get from Google, Apple, Waze or most other...

Pollinate Ep. 18- Denise Lu & Telling Stories With Maps

| 05.11.23

You can tell a good story with words. But a great story compels an audience through thoughtful visualizations. In this episode, Denise Lu walks us through her career in journalism—from her involvement in a student publication in college to her current role as Senior Graphics Reporter at Bloomberg News. We discuss what makes cartography and...