blog/Climate Change

Using interactivity and animation to bring data-driven mocks to life

As designers, our imaginations are the most powerful tools in our toolkit. They help us bring static mocks to life by thinking about how a user might interact with our ideas. Imagination can also hold us back sometimes, as it can be very challenging to communicate these interactions to others. It can also only get...

Visualizing ecosystems with MPG Matrix: A new approach to land management

| 06.27.24

Has anything like this ever happened to you? It might not seem like it, but these stories are likely the impacts of a poor resource management decision. Ecosystems are composed of an extremely complicated web of plants, animals, microscopic organisms, fungi, people, precipitation, and so much more. When the abundance of one component changes, the...

Designing the Avocado of Uncertainty

| 05.30.24

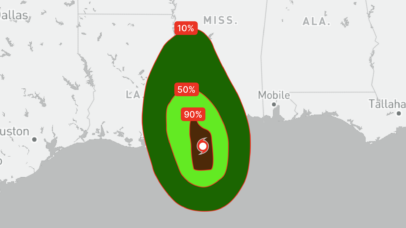
Perhaps you’ve noticed over the past decade how that “once in a century” forest fire or hurricane seems to be appearing in the news more often than its name would imply. With temperatures increasing due to climate change, natural disasters are increasing in both frequency and intensity across the world. In these situations, it’s of...

Dreamy, aspirational cartography with Spherical

| 08.10.23

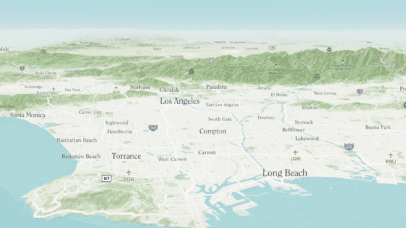
Earlier this year, Stamen collaborated to design a custom branded basemap with our friends at Spherical, a creative technology design and integrative research studio supporting projects regenerating the health and integrity of Earth’s living systems. In partnership with ARLA, Spherical supports community workshop facilitators with their Living Infrastructure Field Kit, a space to explore the...

The charismatic megafauna of climate change maps

In the latest episode of the Stamen Pollinate podcast, Stephanie May talked with cartographer Jeffrey Linn about his fascinating series of sea level rise maps and about the concept of “speculative cartography”. Maps that show familiar coastal cities flooded by water are viscerally terrifying and visually compelling, but as cartographers we often struggle with the...

Making a snappy raster map with shaders

| 04.18.23

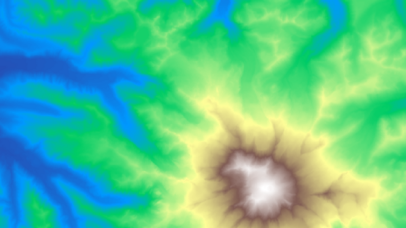
One of the exciting aspects of working at Stamen Design is that we work with all kinds of data. Not only do we get to explore what story the data is telling us, but we also get to explore how to tell it from a technical perspective. A challenging data type for web mapping are...

Pollinate Ep. 17- Jeffrey Linn & Speculative Cartography

| 04.13.23

As we emerge from three years of pandemic, social isolation, and political instability, how do we as humans cope with living in an uncertain world? How do we find joy and connection while acknowledging the inevitability and looming threat of climate change? In this podcast episode, Cartographer Jeffrey Linn introduces us to the concept of...

Connecting the Dots: How Data Products and Design Help Address Systemic Threats

The myriad and complex challenges of addressing climate change can feel overwhelming, but when you combine the wealth and power of data available with communication strategies, it becomes possible to imagine a future where we are valuing conservation, relying on renewables, promoting efficient industrial, consumer, and agricultural processes, and not pumping greenhouse gasses and pollutants...

Visualizing critical disaster data with ReadyMapper

| 03.08.23

With climate-related natural disasters on the rise, it has become increasingly obvious that we lack the tools to provide useful information as crises unfold—the venn diagram of crucial data and real-time communication has painfully little overlap. Since early 2022, Stamen has had the pleasure of working with CrisisReady and Direct Relief to create ReadyMapper, an...

Pollinate Ep. 5- Christina Conklin & The Atlas of Disappearing Places

| 04.14.22

Time. Space. Salt. No, these aren't a new take on necessary elements for cooking a delicious meal. They are some of the core themes that artist and author Christina Conklin explores in her work. Whether it's patiently waiting for saltwater to evaporate and form intricate patterns on a concrete floor or painting maps of climate change data on dried sea lettuce, she is inspired by the ocean and all the elements and organisms within it. In this episode, Christina discusses her book The Atlas of Disappearing Places and the beautifully painted maps that accompany insightful and thoroughly-researched stories that elucidate the intimate connectivity between humans, the ocean, and the planet we all call home.