
A personal history of OpenStreetMap, seen through the eyes of Stamen Design
by Alan McConchie and the Stamen Design team

Recap
Back in 2021, we wrote a two-part blog post about the history of Stamen Design and OpenStreetMap (“OSM” for short), and the twists and turns of Stamen’s close relationship with the OSM project over the years.
In Part 1, we covered the years from the creation of OpenStreetMap in 2004 and Stamen’s early experimentation with OSM data through to 2011. In Part 2 we covered the years 2012 to 2016 when Stamen released our three high-profile map styles using OSM called Toner, Terrain, and Watercolor, and kept up a furious pace of producing open source mapping tools and yet more basemaps for Pinterest, Tableau, CartoDB, and many others.

We left off on a bit of a cliffhanger, with some ominous changes in the geospatial market around 2016, which we alluded to at the end of Part 2. We always planned to finish this series with a final Part 3 at some point, and since we just finally shut down one of our last old-school mapping projects from the early years called Map Stack (we’ll talk about that at the end of this post) it seems like a good time to finally finish our story. Or at least, bring it up to the present in 2025.

2016-2020-ish: OpenStreetMap gets serious
After our last big updates of our core Toner and Terrain basemaps in 2016, Stamen’s pace of new work with OSM slowed down a bit from its previous breakneck speed. We had plenty of work for other clients and on other topics, and our basemaps were as popular as ever before (after Google and MapQuest started requiring API keys, our maps were one of the few free map services still standing), but we didn’t add much more new public OSM work to our repertoire (our 2018 work with OpenDroneMap perhaps as the exception that proves the rule).
What caused this relatively quiet phase?
One reason could be widespread usage of Mapbox’s vector tiles (and in particular the ability for “anyone” to style them with Mapbox Studio) there was less call for us to make custom OSM basemaps from scratch. In this era, Mapbox was the juggernaut of the open source web mapping industry, releasing a wide range of tools that provided a new foundation for a generation of applications, and in particular their hosted platform was light years ahead of anyone else. It felt like Mapbox had solved the problem of making a uniquely styled OSM map, at least for the most common use cases. A lot of clients who previously would have needed Stamen to customize a map could now do it themselves with Mapbox.
Another reason was the shooting star of Mapzen, a well-funded but short-lived startup that took a lot of the air out of the room for the kinds of OSM experimentation we were accustomed to doing. For example, we were working on an ongoing project called OpenTerrain (a Knight Foundation funded effort to catalog and synthesize open elevation data) when Mapzen showed up with more funding and more people and built something similar and much faster than we could! Less than two years later, though, Mapzen shut down and everyone was laid off (although that terrain data is still hosted by AWS and the Linux Foundation, thankfully). We love the work that Mapzen did during those few short years (and they counted many illustrious Stamen alumni among their team members) and although we are jealous of the work they got to do, we are sad they didn’t get to continue their work longer.
Our OSM basemaps (Toner, Terrain, and Watercolor) were still wildly successful and we were still giving them away for free, which was no longer sustainable for Stamen in a changing market. While we were delighted by their popularity, our rapidly growing server bills during this period made us think twice about launching any new free services for a while. But we’ll revisit that issue at the end of this post.
As an aside: for some broader context about the ups and downs of the open source geospatial market during this era, Ingrid Burrington recently wrote an interesting blog post about the relationship between web maps and venture capital during economic recessions. While we are not a startup (VC-funded or otherwise) it’s interesting to see how Stamen’s individual experience maps onto these broader economic trends.

Despite the lack of any big high-profile new OSM services projects during these years, we still incorporated OSM as a part of many projects, often in more subtle ways. We kept using OSM basemaps anytime our data visualization projects needed a map in the background, increasingly using styles we designed ourselves using Mapbox Studio.
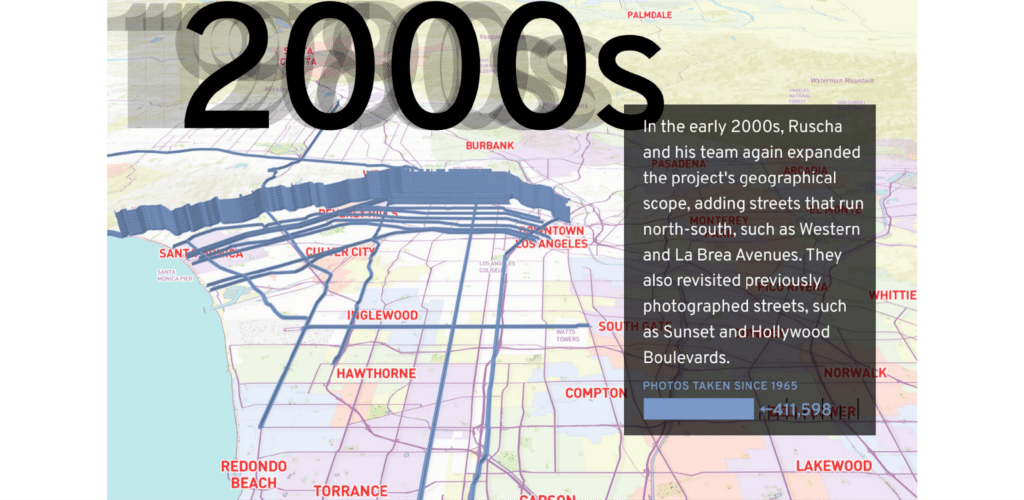
One such map appears in work we did with the Getty Museum called “12 Sunsets”, which launched in 2020. The project is an interactive experience of the artist Ed Ruscha’s photographic archive of the streets of Los Angeles going back over 50 years, and the primary way you interact with the interface is through an embedded scrollable map of Sunset Boulevard. We wanted this map to have a visual feel that fit with the subject matter, and settled on a custom map style we developed that draws inspiration from the famous Thomas Guide spiral-bound street atlases that were a ubiquitous part of automotive life for Angelenos in the pre-GPS era, and which Ruscha himself used for planning his photo shoots.

We even designed a version with some more authentic full-color details that we didn’t include in the version as part of the 12 Sunsets map, like the beautiful pastel tinted areas for suburban cities that are such a distinctive part of the physical Thomas Brothers maps.
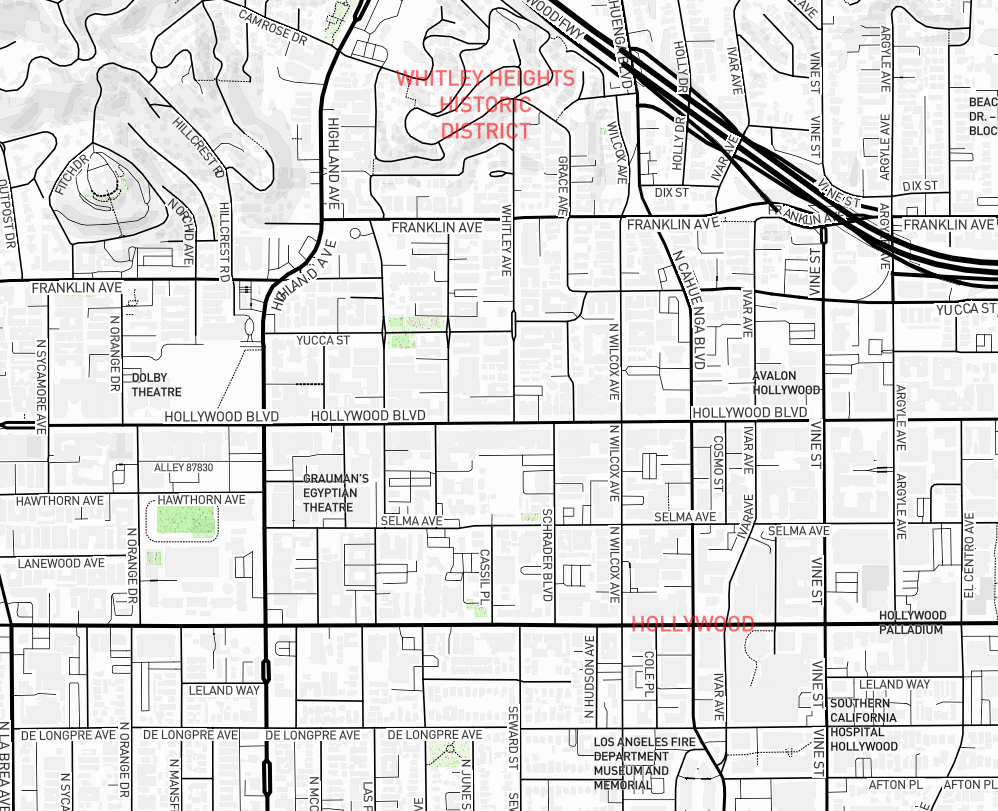
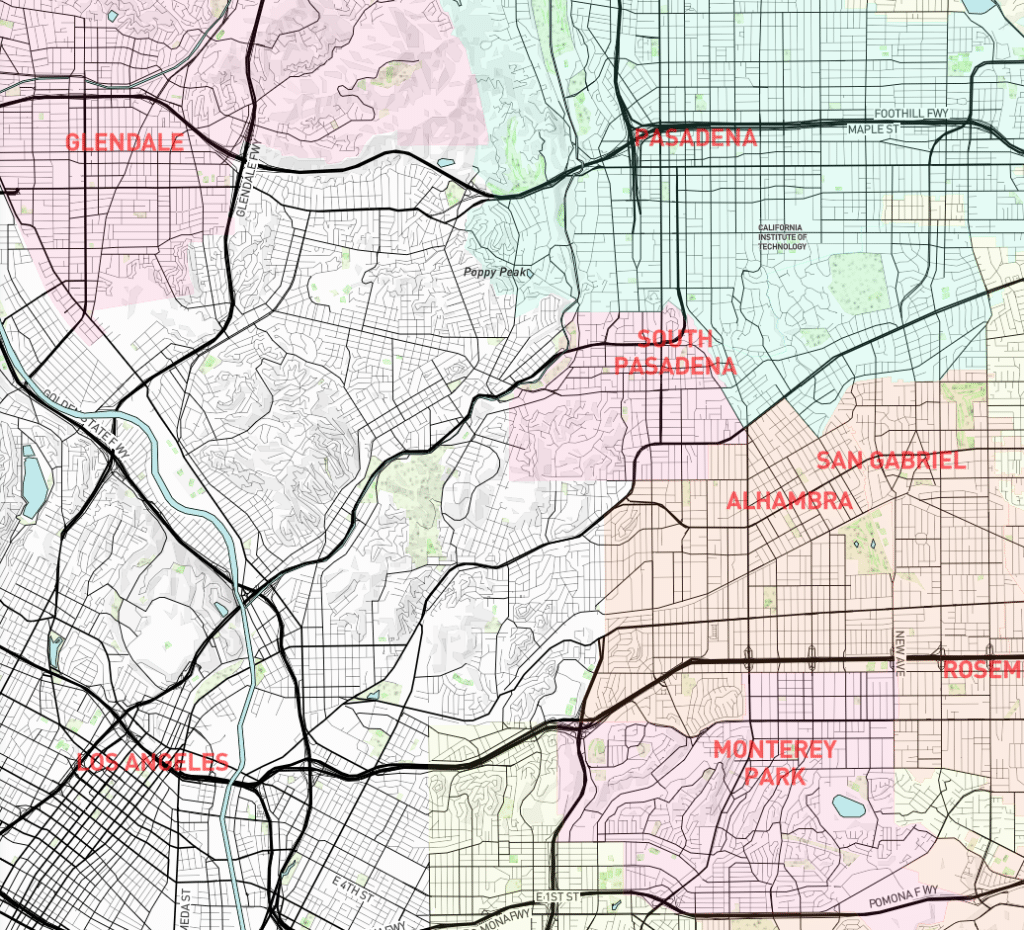
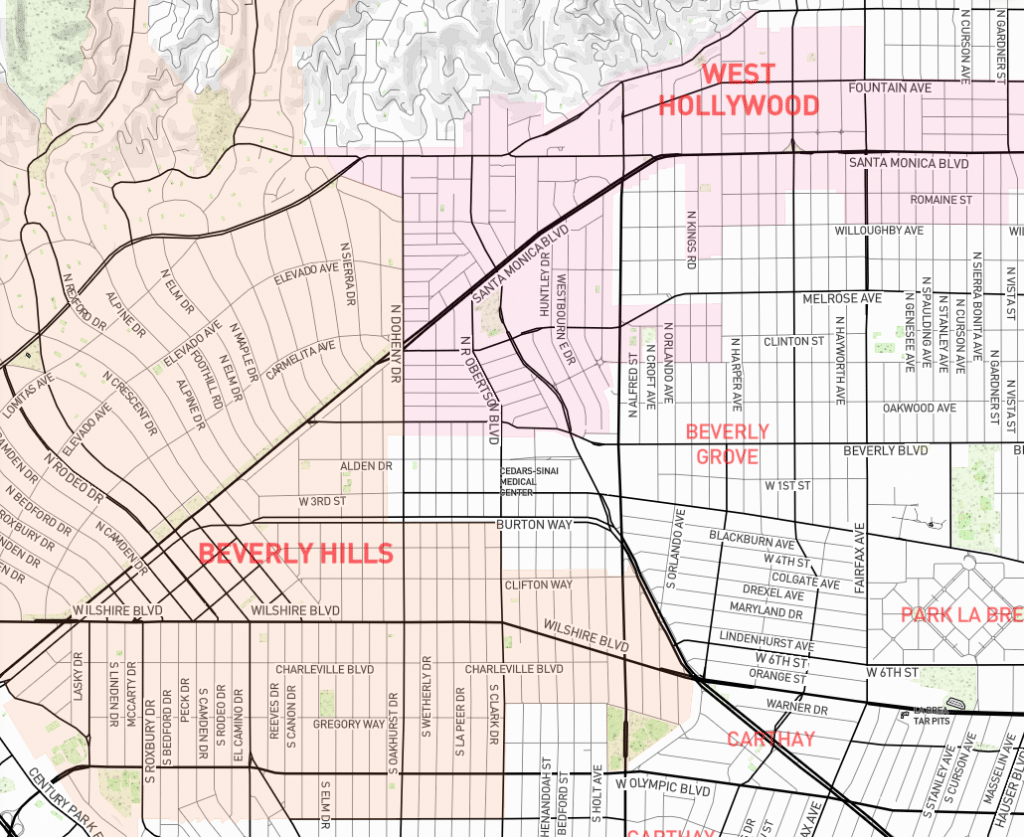
As luck would have it, over the last couple years we got to revisit this map as part of another project with The Getty, creating more map visualizations as part of a new online publication about Ruscha’s work called Artist, Image, Archive, City. We used this Thomas Guide inspired map as the basis for a visualization of all the streets photographed by Ruscha over the years, which expanded well beyond his original focus on the Sunset Strip alone:
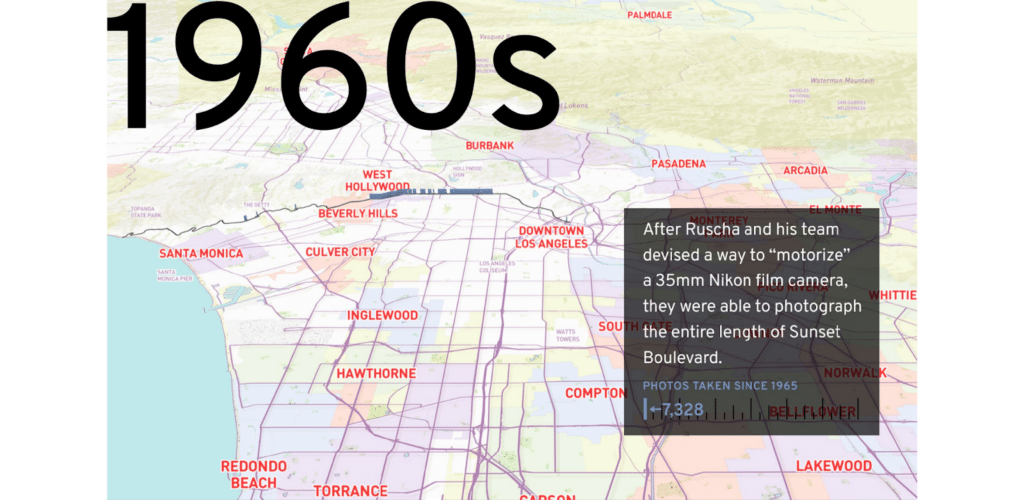
The maps in Artist, Image, Archive, City are not interactive, but if you want to browse the map style itself you can view just the Thomas Guide map style in our Mapbox account.
We also kept active in the OpenStreetMap community during this period, contributing to data and tagging discussions. We assisted with the import of public building footprints and address data from Los Angeles County’s public data portal into OpenStreetMap, and along the way we were so enthralled by the beautiful geographic patterns of landuse that we made a minimalist abstract map project from the data. Yes, another map of L.A.! The map started as a rough diagnostic tool for looking at overlaps between buildings and parcels in order to correctly assign a street address to the correct building (assuming that generally the largest building on the parcel should get the address, not the smaller detached garage in back) and after applying a white to black gradient for buildings from largest to smallest, we started seeing fascinating patterns when we also applied a reverse gradient from black to white for the largest to smallest parcels. Whether or not it means anything we’re not sure, but there do seem to be some difficult-to-articulate spatial stories about urban density and settlement patterns through various phases of LA’s history that emerge as you browse literally millions of shapes over a seemingly endless landscape. The interactive site (previously hosted on CartoDB) sadly no longer works, but you can browse some static snapshots of the map that we archived on Flickr.

We collaborated with GreenInfo Network and a consortium of public lands agencies to propose OSM tags for mapping unauthorized “social trails” so that land managers could exclude them from public maps. As OpenStreetMap was becoming more widely used during this era, professional GIS data managers–who were, by and large, generally dismissive of “crowdsourced” OSM data in the early days–realized they couldn’t ignore OSM anymore and were looking for help understanding and incorporating non-authoritative data in their maps, and contributing their data back to the community. At Stamen we found ourselves often in the role of a liaison between map data contributors and the end users who needed to use OSM data and could bring it to a wider audience.

We also helped get native reservations (many of which were already included in the OpenStreetMap database) to show up on the default OSM map, a process which required navigating various hoops and gaining community buy-in, a process common to working with decentralized open source volunteer communities. It also involved some delicate and fascinating cartographic work to add a new feature to an already very detailed map style that is the product of dozens of volunteers and years of shared effort, finding a color not too similar nor too different from the existing features on the map, adjusting other features to slightly shift their colors or styles as a result, and so on. In the end we’re pretty happy with the result, and you can learn more about the whole process in our presentation at the 2019 NACIS cartography conference.

2020-present: Going Pro with Full Stack Cartography

Despite the fact that we weren’t announcing any big new global basemaps between 2016 and 2020, we had at least one really major OSM-related project cooking behind the scenes: in late 2020 we announced that Stamen had been working with Facebook on a massive and long-running project to launch a new Facebook Map based on OpenStreetMap data. This was a scale of attention and engagement that was new to us at Stamen, with a significant portion of our crew embedding into Facebook’s maps team and working directly in their infrastructure over a multi-year timeline. Big projects require big investment, and we were really pleased when we finally got to share the results with the world at large. You can see an introduction to the project in Stephanie May’s presentation with Facebook engineer Vlad Gluzman Peregrine at the 2020 NACIS conference, and read more detail in Jonah Adkins’s blog post from 2021.

The decision by Facebook (now “Meta”) to build their own mapping platform from the bottom up signaled a new stage in the maturity of the mapping industry, and in the role of OpenStreetMap within it. Some of the biggest players in the technology industry were beginning to realize that for strategic reasons they didn’t want to be dependent on Google Maps (still the “default” option if all you care about is just having a map on the web) but due to economies of scale they were beginning to outgrow platforms like Mapbox as viable alternatives.
Big companies didn’t need a mapping solution, they needed expertise and advice about how to build all the necessary parts of a mapping platform within their own infrastructure. And they needed to know the best practices and pitfalls of working with OpenStreetMap data in particular throughout the whole process. That’s what we provided to Meta, and subsequently to a few other big corporate clients in this era (unfortunately, in some cases we’re not at liberty to name names).
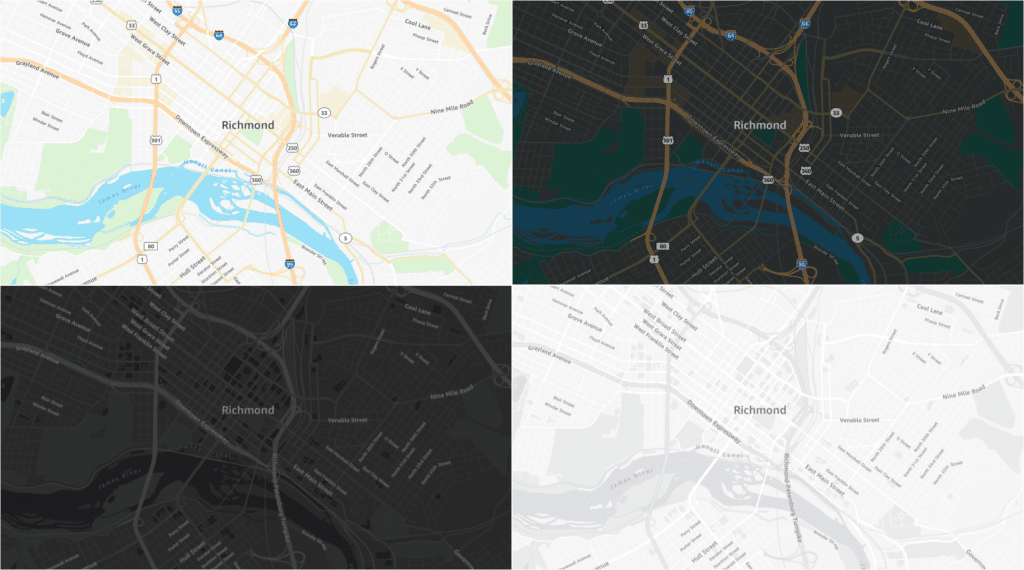
The most recent work which we can share about is with another major online platform, Amazon Web Services. In 2023 AWS released a suite of four basemaps built on a fully open-data stack. These maps are available for anyone who is building applications on AWS who needs a map as part of their offering. We designed two reference maps (in light and dark mode) and two cleaner, more minimal versions tailored for use underneath colorful dataviz overlays.
These AWS maps used the Daylight distribution of OSM data, a quality-controlled release of OSM’s database that has been thoroughly checked for vandalism and data consistency provided by Facebook. It’s inspiring to see some of the biggest tech companies in the world choosing to work together and share their improvements to OSM with each other, all in the name of making open map data more accessible and usable for all.
Working with Amazon, as with Meta, we were able to provide technical advice about how to set up data processing pipelines and vector tile schemas, cartographic design skills to create beautiful and functional basemaps for a variety of use cases at scale, and OSM-specific data expertise about how to understand and translate some of OSM’s unique tagging conventions into a usable global map. At the 2024 State of the Map US conference we shared a deep dive into just one aspect of the research that goes into styling a global OSM-based map: the complex world of highway networks and numbering schemes that enable rendering distinctive highway shields on maps.

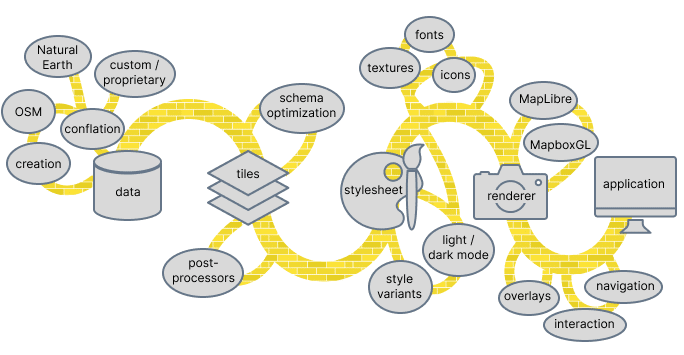
Through our experience with Meta, and then Amazon (and a few other clients along the way) we really started to realize what it was that was special that we were doing for these big organizations. The key way that Stamen provided value was by helping them understand the sheer complexity of the undertaking of creating their own basemaps, and guiding them through all the steps from database to data processing and on through cartographic styling and map rendering. Gradually the concept of “full stack cartography” started to form in our minds as a way to structure this process, and to explain to clients what we do and why they need our help. I feel lucky to have worked with my good friend Stephanie May during this period as we developed these thoughts with the help of the rest of our team.
We tried articulating this “Full Stack Cartography” concept in a variety of ways, through a mini-podcast interview between Stephanie and Alan, an appearance on the Mapscaping podcast, a conference presentation, and even a decision-making flow chart.

Sharpening our tools
In conjunction with this focus on Full Stack Cartography, we’ve also been building out a lot of open source tools to help us be more efficient when designing and building open source maps from the ground up. Some of these tools, like Maperture, Chartographer, Figmasset, and Route Simulator, we have talked about at various conferences and in blog posts already, while others still haven’t been released publicly but will be soon.
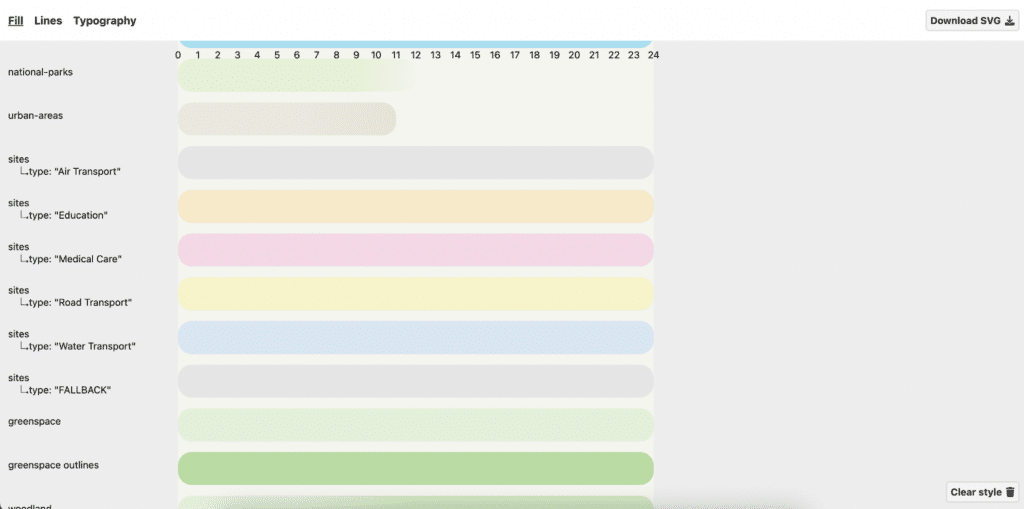
Our latest featured tool is our style build system, which sits at the center of all of our work, enabling us to maintain a complex suite of related styles without duplicating effort. Kelsey Taylor shared about the build system at the 2025 State of the Map US conference:
While these tools don’t strictly have to use OpenStreetMap data, they fit nicely into this open source ecosystem of tools and data that feed off each other and amplify the possibilities of each. Would all of these mapping tools have been created if OSM didn’t exist? And what would OSM look like if it wasn’t constantly being renewed and reimagined by new maps and new applications based on the core OSM database and its community?
At the core of most of these tools is the MapLibre map rendering library, a fork of the Mapbox GL vector rendering that has been adopted by the community and financially supported by a number of large companies that depend on OSM and open mapping. We’ve also been involved in some of the further development of MapLibre by improving its backend code to work on Metal, Apple’s graphics framework for iOS devices (work led by our friends at Wet Dog Weather) and by prototyping a new MapLibre Tile Format along with Dane Springmeyer.
Stamen’s basemaps: Leaving the nest, or pulling the plug?
During all this time building global basemaps for big tech companies, we continued to provide our own OSM-based map tiles to the public free of cost, and kept the lights on at Field Papers, although during these years we had little time budgeted to give these services the care and attention they deserved. Bit by bit, parts of these services stopped working, the data got more and more out of date, and the bug reports and feature requests stacked higher and higher with no budget to address them.

Still, it was remarkable that our free map services were still working at all, and delightful that they were still being used so heavily. Occasionally we’d get a chance to survey how widely these maps were being used, for example by looking at the annual #30DayMapChallenge hashtag on social media, and marveling at how many projects included our basemaps in some way.
The costs without alignment to our services business were, however, becoming untenable. Our server bills were the equivalent of an extra person on payroll, which is quite a burden for a small shop like ours (Stamen’s size has changed over the years and has never been more than a few dozen people at our busiest times). We knew going into this that there would be costs; we’d all heard the old adage from Free Software pioneer Richard Stallman: “Think free as in free speech, not free beer.” But we were beginning to learn that there were other kinds of “free”:
There are four kinds of “free” in free software:
— Kate Compton
Free as in beer
Free as in speech
Free as in mattress
Free as in puppy
Most of the time, we found some way to keep things going. And we also realized that the effort to fix things wasn’t really that much more work than the effort to shut things down. And if we were going to shut things down, shouldn’t we have stopped long ago? For several years, decision paralysis reigned, in want of supporting so many people still using Stamen’s maps.
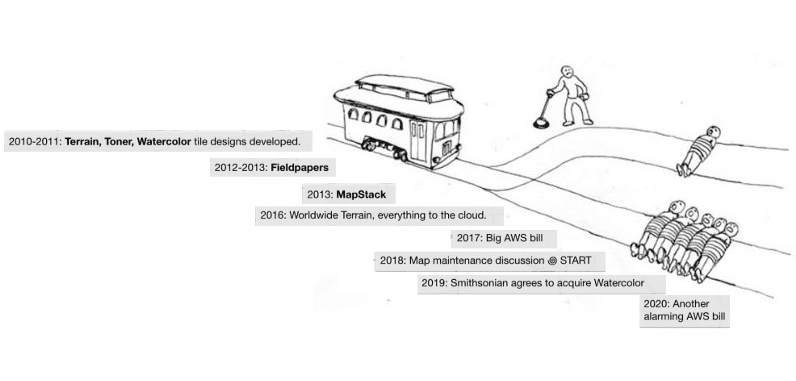
Internally, we started referring to these conflicting impulses by shorthand: the Marie Kondo approach (shut it down, let it go, say goodbye) vs the Lebowski Doctrine (these maps felt like a familiar old carpet that “really ties the room together”).

In the end, the more we understood the Full Stack Cartography paradigm, we came to accept that maintaining these free services ourselves within our working business model couldn’t be sustained forever, and we knew they were in real need of an update (data and tiles) to continue being useful. So in 2023 we made the difficult but necessary decision to find new homes for our legacy free OpenStreetMap services.
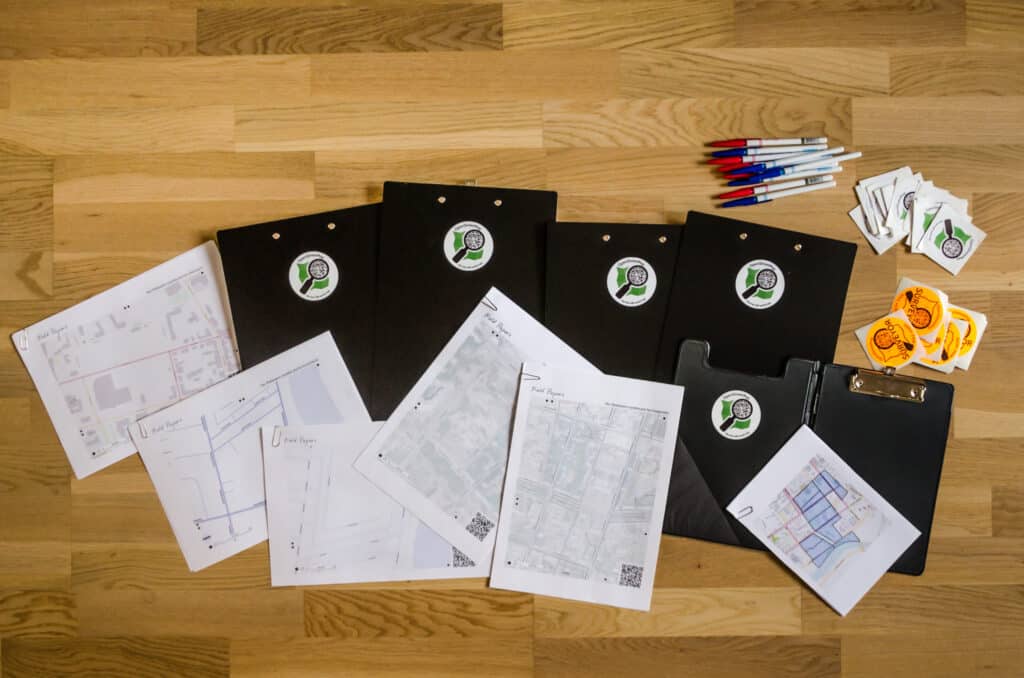
In the previous parts of this history, we talked a lot about Field Papers, a website that lets you create printed maps designed for offline data collection for OpenStreetMap. We worked with the OpenStreetMap US organization (a non-profit entity supported by OSM contributors and businesses in the USA, but with an interest in supporting OSM users worldwide through a number of charter projects) and transferred the Field Papers tool to their care. It was a satisfying moment to finally flip the switch and hand off the Field Papers system to the OpenStreetMap US organization, who are much better suited to take care of it for the next generation of volunteer mappers. Long live Field Papers!
As for our three OpenStreetMap-based map styles (Toner, Terrain, and Watercolor), those had much more traffic and operating costs than Field Papers, and it seemed unlikely that they could still be provided free for everyone forever, even if hosted by a non-profit organization. So instead we worked with another partner, Stadia Maps, to find a way to keep those basemaps alive (and just as important, to update them) in a way that’s sustainable, where small non-commercial users and people just learning about OSM could still use them for free, but where heavy users would have to pay a small but fair amount to use the service. Luckily, that is something that Stadia specializes in, and we quickly found them to be a good match for our design and product development services-based firm.
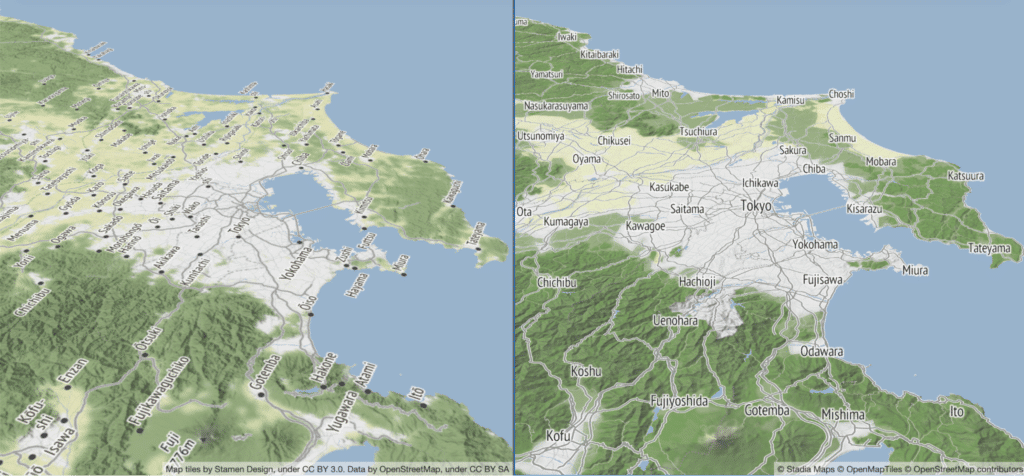
The process of rebuilding our map styles on a modern, vector-based toolchain also had a lot of benefits for the maps themselves, which we’ve talked about in a series of blog posts with Stadia:
- Here comes the future of Stamen Maps
- What’s next for Stamen Maps
- The end of the road for Stamen’s legacy map tiles
- Familiar maps, brand new data
- Harnessing modern vector cartography
- Terrain behind the scenes
- Helvetica is more than a font, it’s a state of mind
- And finally: The Many Lives of Null Island
Most of those blog posts were summarized in a presentation we gave at State of the Map US in 2024:
As of the end of 2023, we were able to shut off all our old and decrepit raster map infrastructure and redirect our traffic to Stadia’s shiny new system.

And for the Watercolor tiles, they are also archived for posterity in another spot: the collection of the Smithsonian’s Cooper Hewitt Design Museum (as I wrote about back in Part 2 of this series). Last year the Cooper Hewitt had a public exhibition showcasing the new additions to their collection, and our founder Eric Rodenbeck led a tour of the room filled with floor-to-ceiling projections of the Watercolor map:

Finally, just this year we shut down the last of our legacy map tools from the 2010s, Map Stack. Like the other tools, Map Stack had been gradually falling apart. We knew we didn’t want to continue to support it (and after all, its use case of stacking and remixing raster map tiles was mostly made obsolete by the advent of vector cartography in the intervening years) but the traces of activity left in our databases still intrigued us and we wanted some way to keep that archive alive. So instead of turning off the lights completely, we decided to make a new tool to explore the millions of maps that people had created over the years. This new “map of maps”, or “Map Stack Stack” as we eventually decided to call it, was created by Eric Brelsford and is accessible here: mapstackstack.stamen.com

The future present
And that brings us to the present, more or less. Who knows what the future will hold for OpenStreetMap and our relationship with it?
We’ll keep building our own tools and advising people how to create their own mapping stack when it makes sense to do so, but we’ll also keep using the latest versions of off-the-shelf tools when that makes the most sense. And we’ll apparently keep making maps of Los Angeles using OSM data, like we did in 2023 for Spherical (for a studio based in San Francisco, we sure do make a lot of maps for our neighbors to the south, don’t we?)

We can also be sure to see many more Stamen alums doing amazing things with OpenStreetMap. In recent years we’ve seen Brandon Liu (who worked with us on our OSM basemaps for CartoDB many years ago) created a new map format called Protomaps which is taking off as an efficient and simple way to build a full map platform using OSM data, something we’re eager to try out in future projects. Logan Williams, who worked on many Stamen projects such as 12 Sunsets, now works at Bellingcat, where he developed a tool for journalists to geolocate photos using OSM search queries.

Our old friend OpenStreetMap has come a long way, and Stamen has been delighted to be there to see it all. As we said at the beginning, there’s now no doubt that OpenStreetMap is all grown up, and in fact OpenStreetMap is about to celebrate its 21st birthday and pass that last threshold into adulthood. We’ll be there, raising a glass, or at least partaking of a slice of cake or two. See if there’s an event near you, and let us know what map is on the cake at your OSM birthday party?
